HOW TO CALCULATE FLEET SIZE
The optimal number of vehicles in a fleet varies with time depending on aspects such as market demands, the service level and available budget, and for this reason the organization has to establish when to calculate the optimal number of vehicles that are needed for a certain period of time.
The resulting scenarios for each period of time are:
- The optimal number of vehicles needed is higher than the one the company has, and for this reason there must be an acquisition of those vehicles.
- The optimal number of vehicles needed is lower than the one the company has, and for this reason some vehicles must be disposed of service and sold.
- The optimal number of vehicles needed is the same as the one the company has, and for this reason there’s no need to acquire of dispose any vehicle.
For this reason, based on this information there has to be a plan for acquisitions or disposals and for the possible renovations of certain vehicles in order to accomplish the service level and assigned budgets for this period of time.
Join to The Fleet Management Group
 In this group, you can know and share knowledge, experiences and meet people interested in Fleet Management over the world. Each week we publish posts, conferences, news, scientific papers, and technology related to Fleet Management.
Types of vehicle fleets
There are three types of vehicle fleets that can be considered of reference or basic, and are the following:
- Planned routes (Vehicle Routing Problem – VRP): The demand that originates from performing a service are the delivery and/or pick-up locations in certain geographic zones, which have associated an amount of goods, waste, passengers, etc. to be delivered or picked-up in a determined period of time (service level) such as hours, days, weeks, etc. and in some cases have to be done in determined time frames. Some examples of this kind of fleet would be delivery and/or pick-up of packages and/or passengers, cleaning services, trash collection, and mailing services.
- Aleatory demand of vehicles: The demand that originates from the random use of the vehicles in time in a geographical area, like people that use the vehicle to transport themselves geographic (car rental companies, taxicabs, car sharing) or incidents that demand attendance such as firefighters, police, traffic accidents, towing services, or ambulances. In these cases the clients or users could be in a queue in order to use any vehicle of the fleet.
A particular case is when there is a set of vehicles that perform a service for another set of vehicles, like it’d be the case for public works or mining, in which there are the following vehicle categories: vehicles extracting land (excavator), and other vehicles that transport it geographically (trucks), for which it’s necessary to calculate the optimal number of vehicles for each category considering both.
- A vehicle assigned to a driver/user or to an activity: te demand that originates the service performance is a vehicle assigned to a driver/user or a specific activity, since there aren’t any planned routes or aleatory demand like in the previous cases. Examples of this would be: vehicles used by company’s executives for private use or commercial vendors.
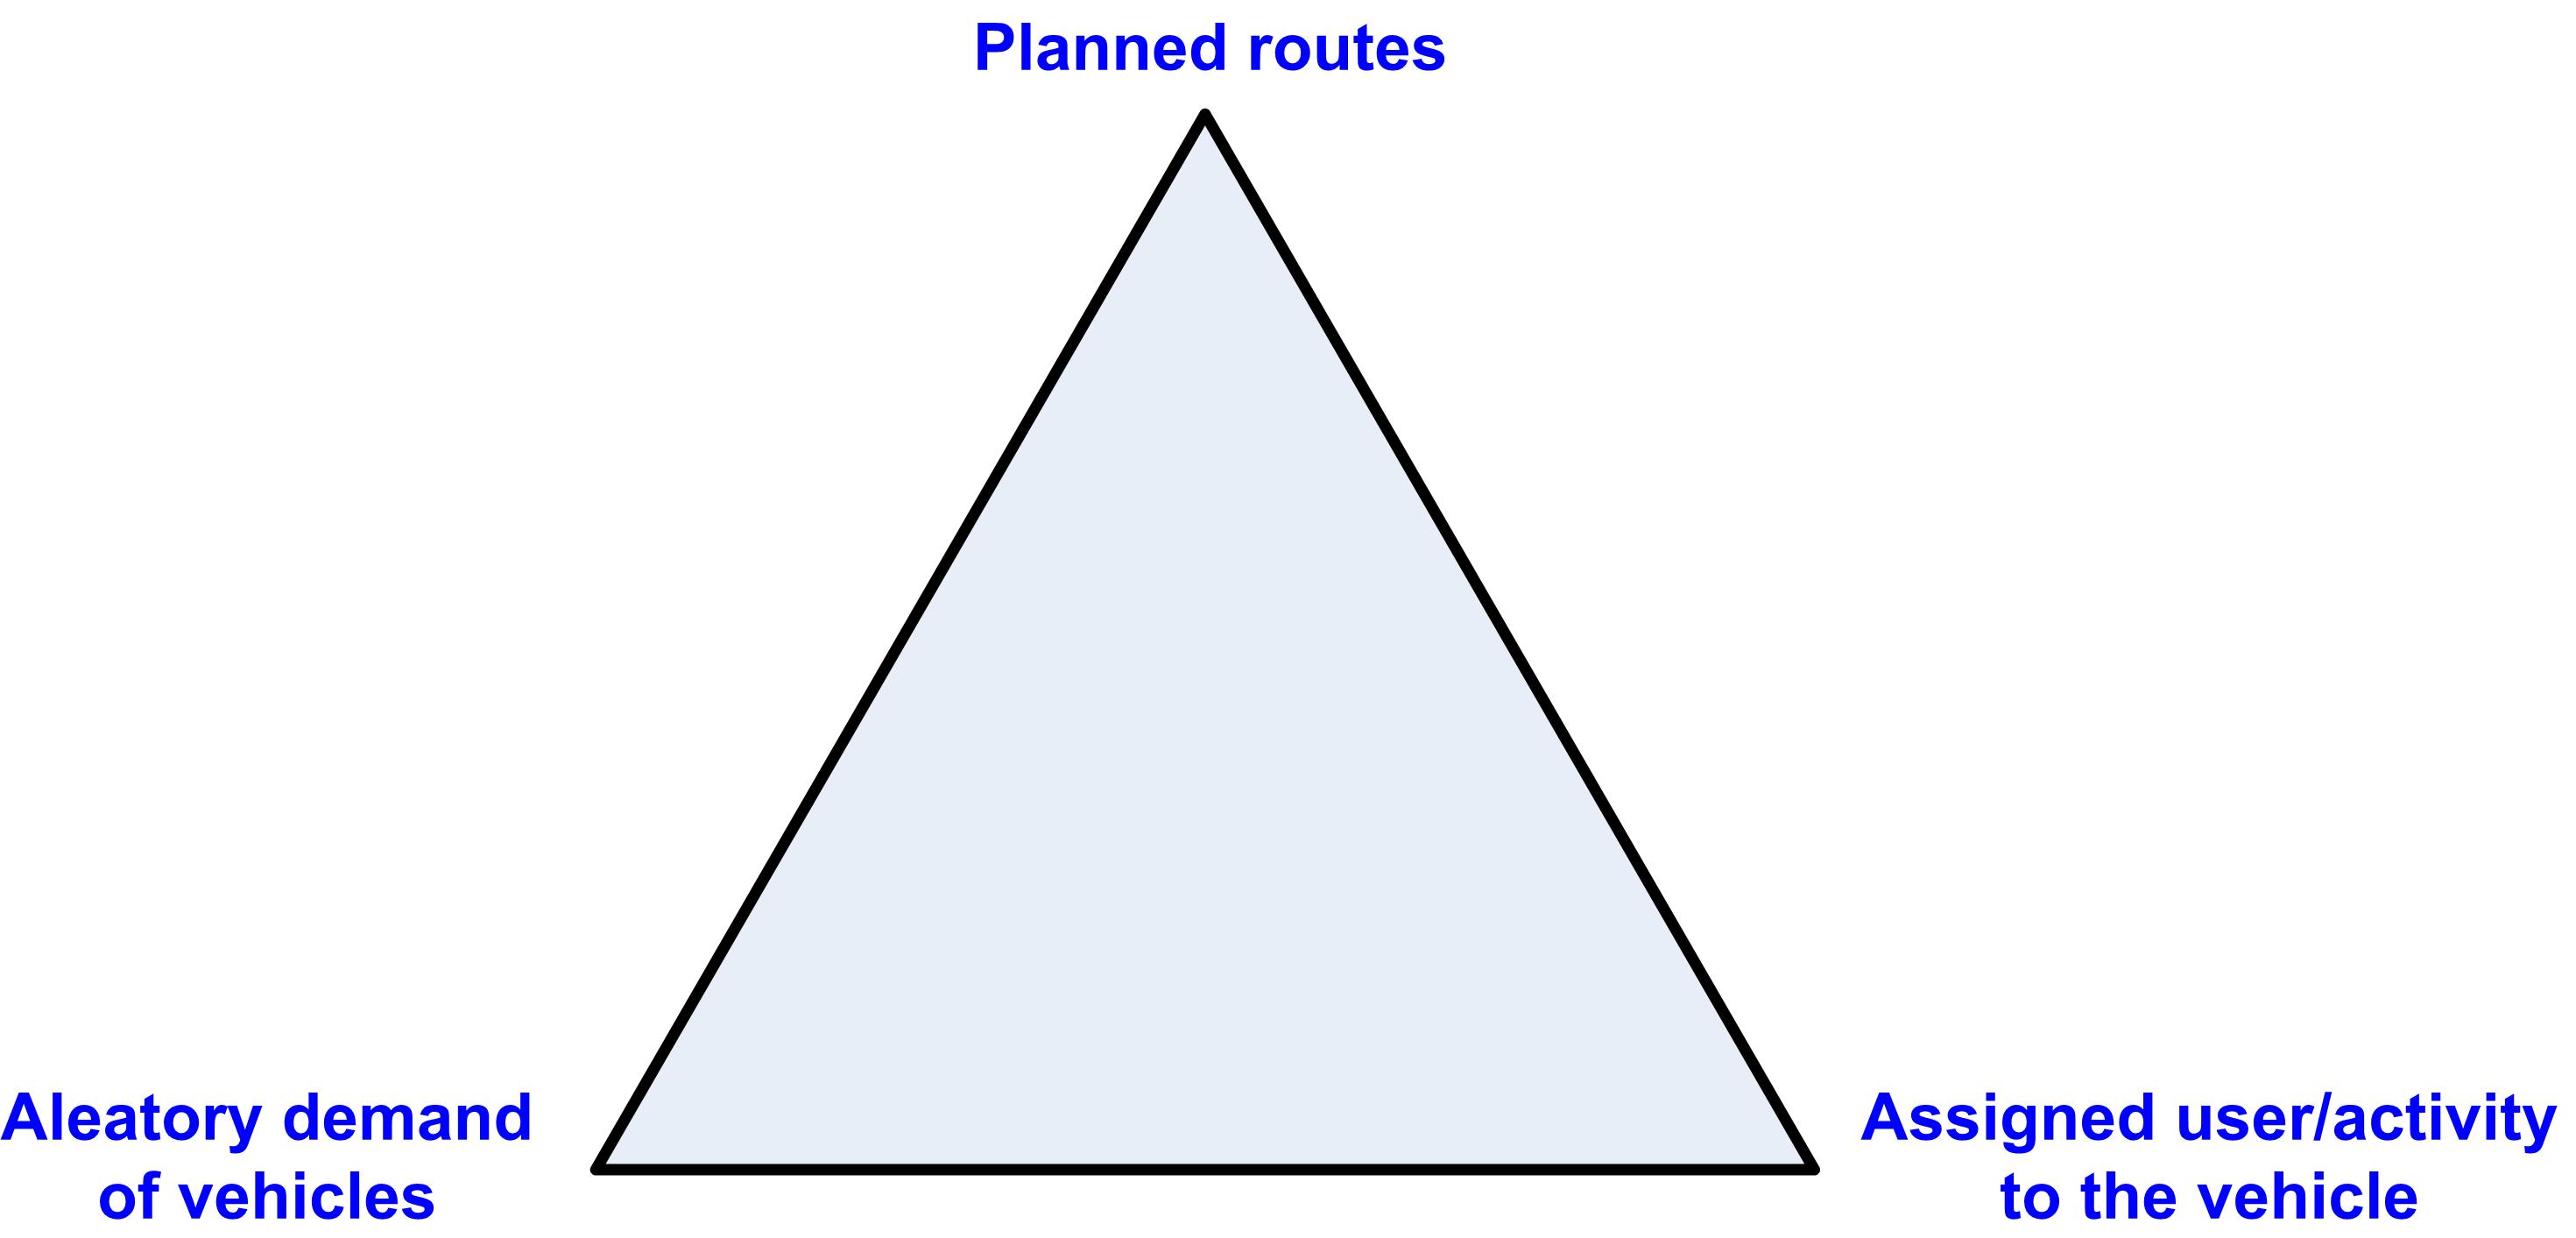
Any type of fleet can be assigned to any position in the triangle shown in graph 1, depending on the characteristics of it. A vehicle fleet can be classified as one of the three reference types of vehicle fleet, or in an intermediate position of two of these three reference types of fleets; because it has the planned routes component and the aleatory demand component, or the planned routes component and the assigned user/activity to a vehicle, or it has the aleatory demand component and the assigned user/activity to a vehicle. Depending on the intensity level of each component, it’d be closer to one type or the other.
Graph 1: types of vehicle fletes.
Next is developed how to calculate the optimal number of vehicles for each one of the three reference types of vehicle fleets. For fleets between two of the three types there would be a need to modify/adapt these proposed models for each fleet.
For example, an intermediate fleet is the sales force of a company where there are clients to visit, and where normally there’s an assigned vehicle to each sales associate, in this case the most important part is calculating the routes to travel in a determined time in order to minimize variable costs or maximize the number of visits, considering that the geographical area to cover is divided in zones to have a sales force equilibrium.
Planned routes
This kind of fleet is referred in the scientific literature as “Vehicle Routing Problem – VRP” and has developed specific methods and models for its resolution. In the market, there is specific available software to solve this kind of fleet.
The graph 2 shows the process to calculate the optimal number of vehicles in a fleet in order to start its operations since the beginning for this case.
Graph 2: process to calculate the optimal number of vehicles in a fleet with routes.
The first step is to establish the service level (time), the approximate number of vehicles that would be used to accomplish it, and the capacity of each vehicles (m3, passengers, tons, etc.).
The second step is calculating the routes, which is recommended to be done with a specific software, and considering one or several sub-optimal conditions like minimizing fuel consumption, traveled distance, time of service, or maximize the vehicle’s load capacity.
The results would be the real service level, routes to travel, or distance to travel. It’s very important what vehicles are being used, because it could happen that some vehicles initially assigned won’t be used, for which they are no longer necessary.
With the obtained results, it can verified if the service level is met, if it doesn’t then they have to go back to the previous phase of establishing the service level or number of vehicles and its capacities, depending on the case one or the other or both will be modified.
If the service level is met, the results would reflect the number of vehicles and their capacities (type of vehicles), the number of drivers and distance to travel, for which the only variable to establish is the vehicle’s brand and equipment.
The fleet’s direct costs or budget for a determined time period is the sum of direct costs, variable operational costs, and the vehicle’s residual value (amortization) if it’s disposed from service at the end of this studying period.
The fixed costs are determined mainly by the vehicle’s type, brand, equipment, and the number of drivers. The variable operational costs are determined by traveled distance or working hours; and the residual value is determined mainly by the vehicle’s age and its mileage/kilometrage.
Once established the vehicle’s brand and equipment, the variable operational costs and residual value can be calculated using the distance to travel, obtaining the fleet’s direct costs or budget for the studying period. Some of the direct costs and residual values require an estimate or previsión.
If the budget wasn’t met, it’d be needed to choose other vehicle’s brands and/or models and have to check again if the budget would be met. If none of the solutions meets the budget, then they have to go back to the previous phase of establishing the service level and number of vehicles. If the vehicle fleet meets the budget, the next phase is acquiring the vehicles.
It needs to be proven that a better solution doesn’t dominate the chosen one, if m is the optimal number of vehicles of the chosen solution, then the service level and its associated costs will be calculated for m -1, -2, -3 vehicles and will compare it to the chosen solution, if said solution is dominated by a better one the last will be chosen.
Aleatory demand of vehicles in the fleet
Scientific literature on operational investigation has developed methods and models for resolving this kind of vehicle fleet, such as queuing theory, simulation, or statistics.
There isn’t an specific software for this, for which a generic software on queuing theory, simulation, spreadsheet, or programing would be used depending on how complex is each case.
The use of the vehicle’s capacity is the main or secondary aspect depending on each case. In car rentals or taxicabs services, the cost of using the vehicle is the same as if one client uses it or several at the same time, the most important thing for the company would be that the vehicle performs the service the maximum time possible, for which the use of the vehicle’s capacity is a secondary aspect. In the case of incidents that demand attendance, vehicles are assigned to a crew and specific equipment, for which the use of the vehicle’s capacity is a secondary aspect. In the case of a public work or mining, the use of the vehicle’s capacity and the percentage used of the vehicle’s capacity are the main aspect.
Graph 3 shows the process for calculating the optimal number of vehicles in a fleet in order to start its operations since the beginning for this case.
Graph 3: process for calculating the optimal number of vehicles in a fleet with aleatory demand.
The first step is to establish the service level, the approximate number of vehicles needed to meet it, and the capacity of each vehicle (m3, passengers, tons, etc).
The service level to establish could be one of the following: that there’s always available vehicles, and for this reason that there’s no queue; that the queue time is shorter than a determined time, the vehicle’s use rate or that several incidents can be assisted at the same time.
The results of this would be the vehicle’s use percentage, the queue time, etc. It’s very important to consider what vehicles are used because it could happen that some vehicles that were originally assigned are not being use, and for this reason they aren’t necessary.
With these results it can be checked if the established service level is met, and if not they need to go back to the previous phase to establish service level or number of vehicles and their capacities, depending on the case one or the other or both will be modified.
If the service level is met, the results would reflect the number of vehicles and their capacities (type of vehicles), and the number of drivers if the service requires it. The next step would be establish the maximum distance to travel, the vehicle’s brands and equipment to calculate the vehicle’s direct costs and budget for the studying period.
There needs to be an established limit of maximum traveled kilometers for the studying period, to be able to meet the direct costs or budget, since the goal is to obtain profits from the fleet. Taking this traveled kilometer limit as reference, there must be established policies for the client to be responsible of all or some of the vehicle’s variable operational costs.
For example, renting companies would establish different rates depending on distance traveled or a rate per mile/kilometer traveled. In a taxicab company, picking-up clients can be done at a taxi station, or traveling “empty” kilometers until a client hails the cab, for which there must be an established limit for maximum “empty” kilometers to travel.
The higher the traveled distance limit is, the lower is the budget for the vehicle’s acquisition, and on the contrary, the higher the budget for the vehicle’s acquisition, the lower must be the traveled distance limit.
Once established the vehicle’s brands and equipment, and the maximum distance to travel, one can calculate the variable operational costs and the residual value using the maximum distance limit, obtaining the values for direct costs and budget for the studying period. Some of the direct costs and residual values require an estimate or previsión.
If the budget wasn’t met, it’d be needed to choose other vehicle’s brands and/or models and establishing the maximum distance to travel, and have to check again if the budget would be met. If none of the solutions meets the budget, then one has to go back to the previous phase of establishing the service level and number of vehicles. If the vehicle fleet meets the budget, the next phase is acquiring the vehicles.
First, it needs to be proven that a better solution doesn’t dominate the chosen one, if m is the optimal number of vehicles of the chosen solution, then the service level and its associated costs will be calculated for m -1, -2, -3 vehicles and will compare it to the chosen solution, if said solution is dominated by a better one the last will be chosen.
Queuing theory
The general model for queuing theory (λ, μ, c), which is the most basic one of this discipline, and the rule first in-first out, are the ones proposed to calculate the optimal number of vehicles and to establish the service level.
Each vehicle fleet can have several variations for this basic model, and for this reason requires a specific model designed for the fleet’s characteristics and goals.
This model M/M/c has two variants: the open model (infinite number of clients), and the closed model (finite number of clients). The formulas that characterize each one of them are different because the queue is made in a different way.
1° The open model is characterized by the following variables:
- λ is the rate of clients arrival (people, incidents, services to perform, etc.) to the system by a determined period of time (consider that it has a Poisson distribution and that two or more clients can’t arrive at the same time to the system).
- μ is how long a vehicle is used by the clients (consider that it has an exponential distribution and that it’s the same for all vehicles).
- c is the number of vehicles to assist the client that arrive to the system.
For an open model to be stable and to avoid having an infinite queue, it must meet the following condition:
ρ=Average arrival rate/System’s capacity= λ/cμ; ρ<1
Equation 1: System’s minimum capacity.
The numbers of clients in the system are the ones using the vehicles and the ones waiting in the queue.
Applying these three variables to the model’s final equations, one would obtain the principle attributes that characterize said model. Some of these attributes are the percentage of the vehicle’s usage, average waiting time in queue, probability of queuing, average number of units in queue, average number of inactive vehicles, number of units that are being assisted by a vehicle, number of clients in the system, average time in the system, probability of having to wait in queue, etc.
The values λ and μ are established for clients, and in order to meet the condition in equation 1 there’s a minimum number of vehicles that must be in the fleet. On the contrary, if there are a number of vehicles equal or higher than the number of clients in the system, there won’t be any client in the queue, and those are the maximum service level and maximum number of vehicles that can be in the fleet. Therefore, depending on λ and μ there’s a maximum and minimum number of vehicles that the fleet must have.
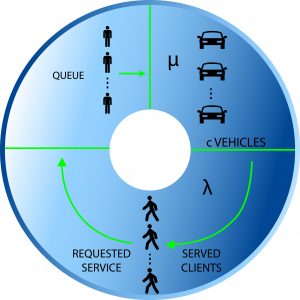
Next is developed a simple applicable example of an open system for a renting company. To simplify this model, consider that it only has one operations center and there can’t be any reservations. The model is like shown in graph 4.
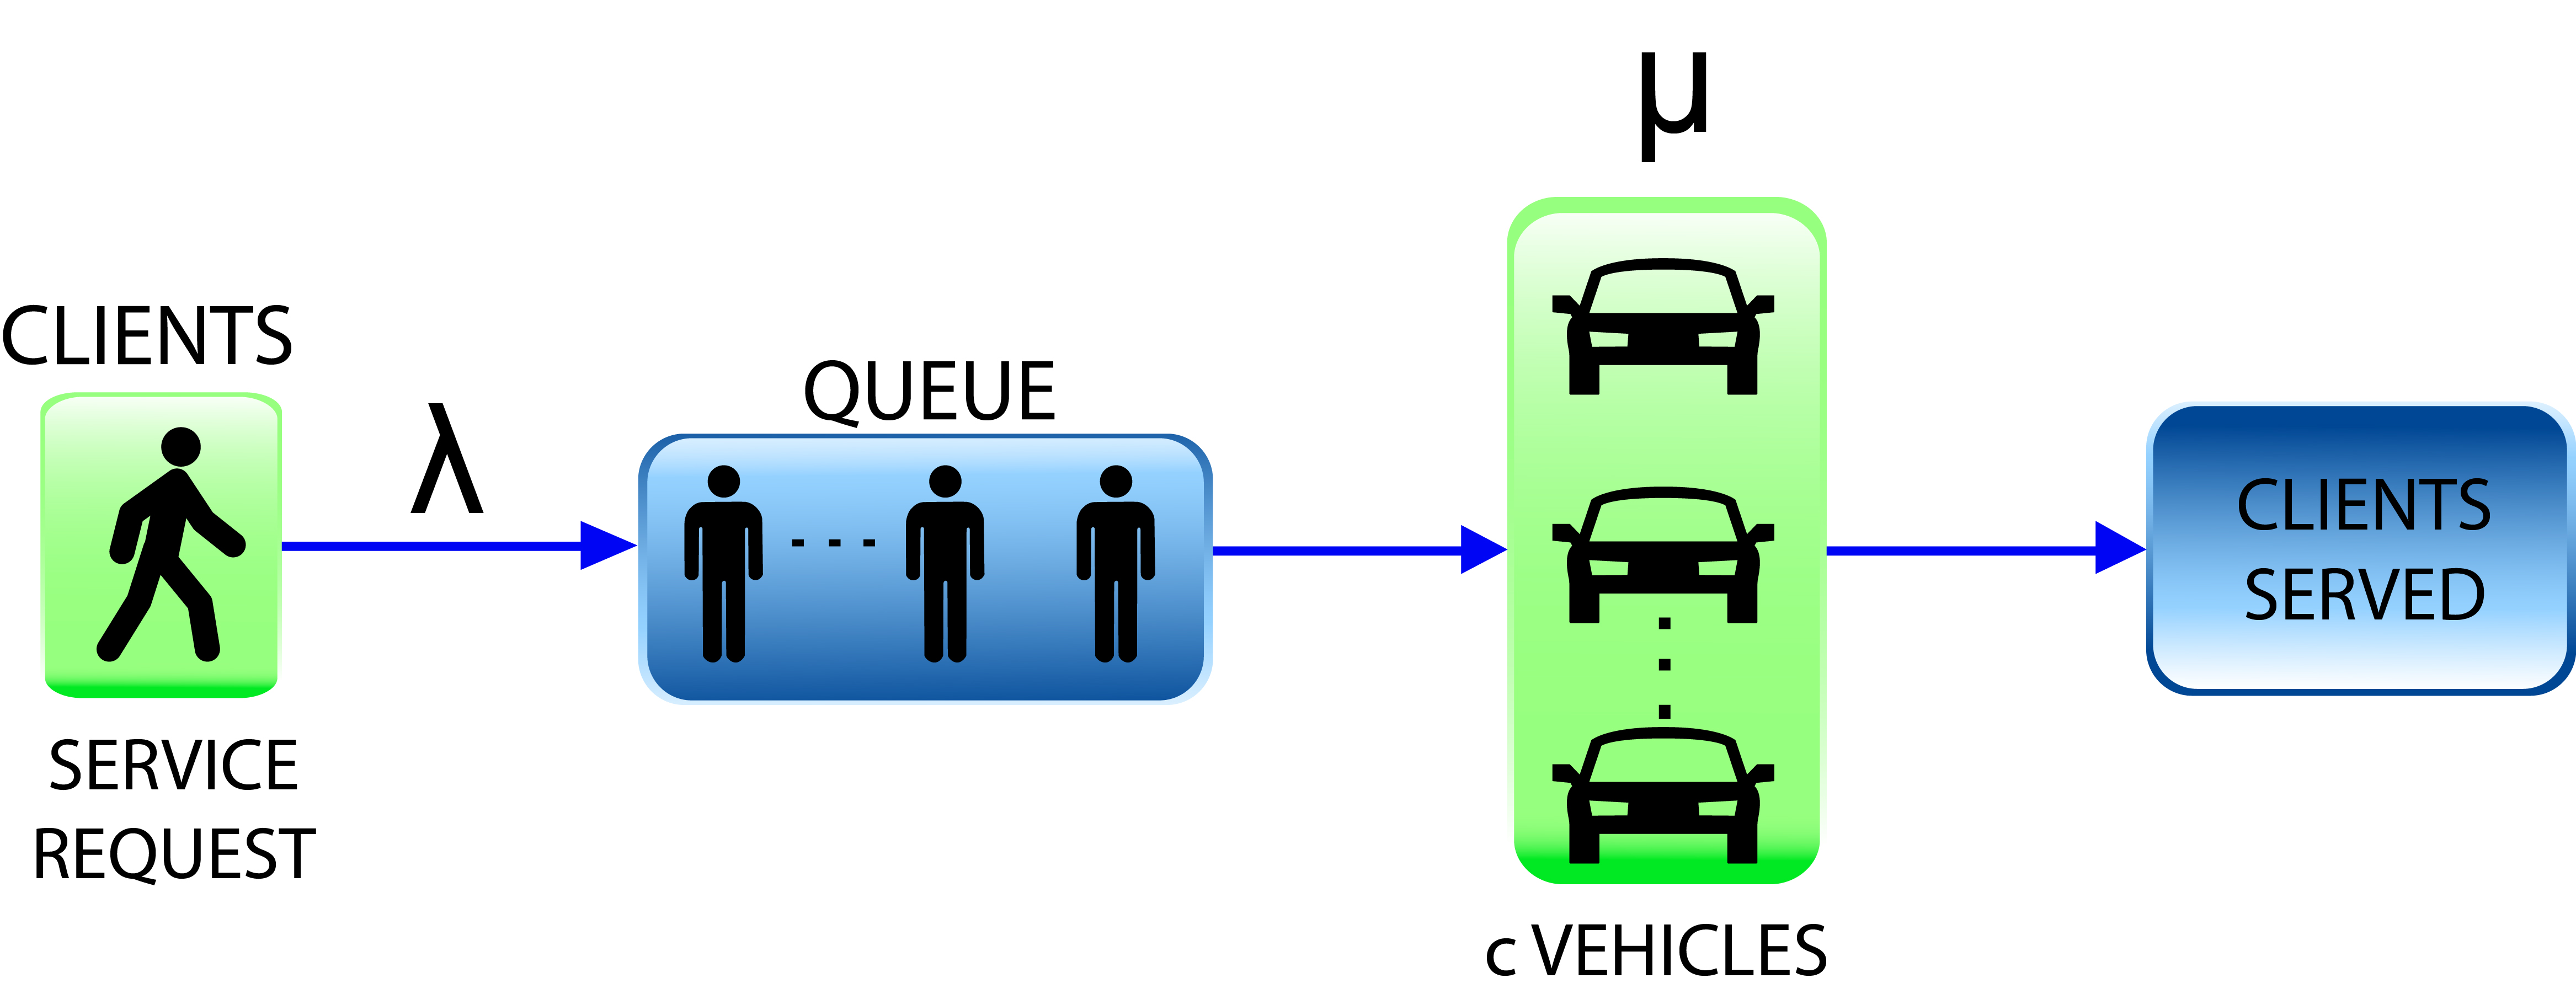 Graph 4: open system for a vehicle fleet’s queuing theory
The clients’ arrival to the system is of 5 people per hour (λ), the rate of usage of any vehicle is of 80 hours (μ), and there’s been established that the service level is that the clients don’t wait more than an hour in queue from the moment they request the vehicle.
Considering this data and using equation 1, the minimum number of vehicles for the system to be stable is 400 vehicles, and there’s a maximum number of vehicles in which there’s no queue and all clients are using all vehicles. Between these two limits, it’s calculated the number of vehicles needed in the fleet to meet the service level previously established, using the model’s final equations from the open model M/M/c.
Having more than one operations center, the vehicles can be picked-up from any of these centers, and it could happen that every center has an optimal number of vehicles, and for this reason for all the fleet. However, because of how the service operates, clients would return the vehicles in some centers more than in others; in consequence, some centers would have more vehicles than others, causing that the service level isn’t met in those center with fewer vehicles than their optimal number, and this would cause a misbalance in the established service level. For this reason, it must be assured that each operations center has its optimal number of vehicles by transferring vehicles between different operations center, and it’s ideal that policies are made about vehicle’s transference between different operations centers. (Zhaolin Li, Feng Tao. 2010).
2º The closed model is characterized by the following three variables M/M/m (λ, μ, c):
- λ is the time between a vehicle’s return until a new vehicle is requested (consider that it has an exponential distribution and that it’s the same for all clients).
- μ is the time a vehicle is used by the clients (consider that it has an exponential distribution and that it’s the same for all vehicles).
- c is the number of vehicles to assist the finite number of clients in the system
Graph 5: closed system for a vehicles fleet’s queuing theory.
The number of clients in the system are the ones in queue, the ones using the vehicles, and the ones that haven’t request a vehicle.
The minimum number of vehicles that the system could have is one, and the maximum number of vehicles is the same as the number of clients in the system so there wouldn’t have waiting time, and this is the maximum service level.
Between these two limits is calculated the number of vehicles c that the fleet needs, using the model’s final equations of the closed method M/M/c in order to meet the established service level.
M/M/c is the most generic model for queuing theory, but there are also several variations, and by using the queuing theory any model could be designed to adapt to the fleet’s operations.
An assigned driver/user/activity to a fleet’s vehicle
In this case the service level is the number of drivers/users, or the activity to perform. Calculating the optimal number of vehicles is simple using a spreadsheet.
Graph 6 shows the process of calculating the optimal number of vehicles in a fleet in order to start its operations since the beginning for this case.
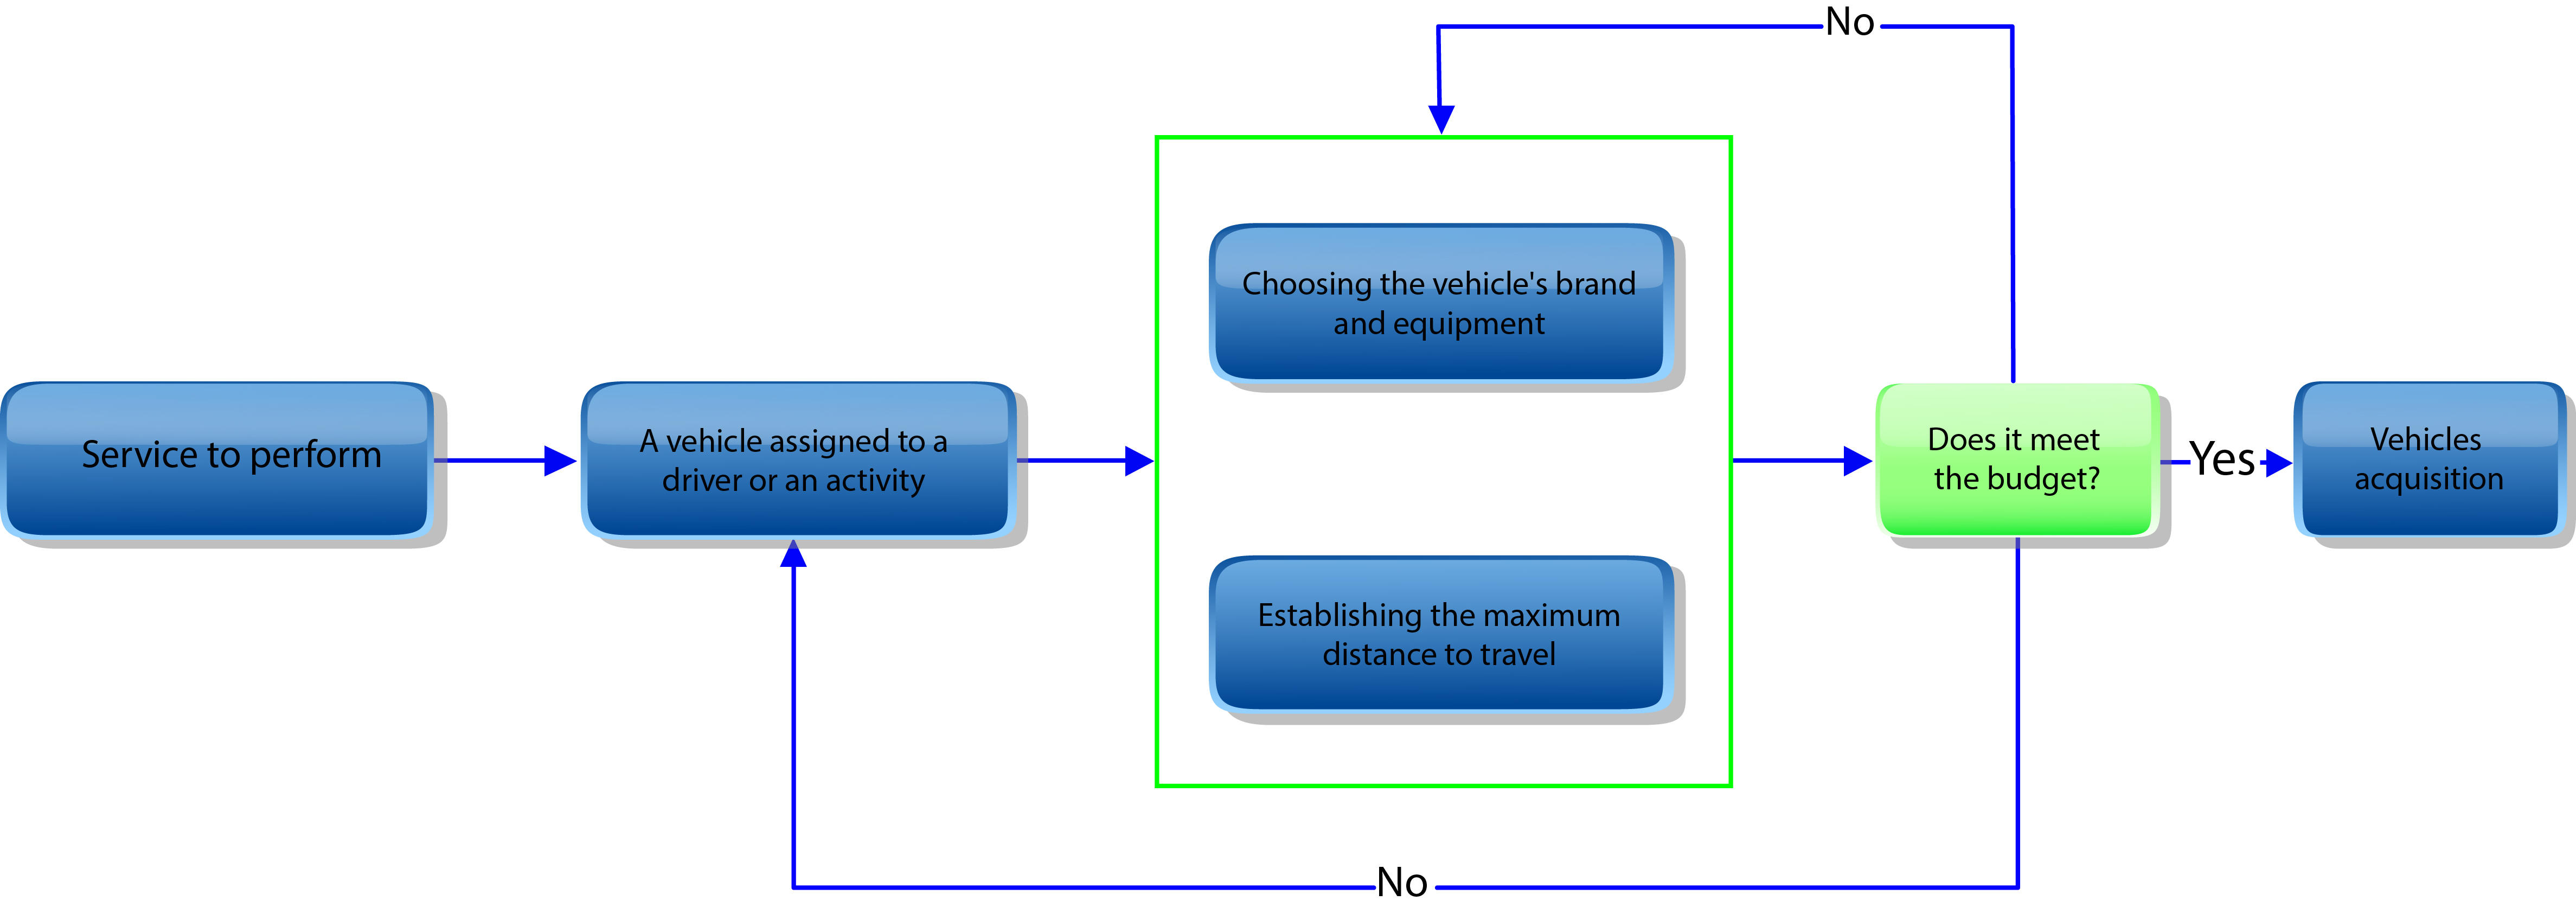 Graph 6: process to calculate the optimal number of vehicles with an assigned driver/user/activity to one of the fleet’s vehicles.
The first step is to know how many users/drivers or activities to perform are going to be assigned to a vehicle.
Once established the service level, the results would reflect the number of vehicles and their capacities (type of vehicles), and the number of drivers, if the service requires it. For this reason, there are two variables to establish: the maximum distance to be traveled, and the vehicle’s brands and equipments.
A maximum limit of traveled kilometers need to be establish for the studying period, in order to meet the direct costs or determined budget, since the goal is to obtain profits from the fleet. From this maximum limit of traveled kilometers, there must be established policies for the client to be responsible of all or some of the vehicle’s variable operational costs.
For example, renting companies that are focused on sales associates or executives of other companies would establish only one change of tires, set the maximum kilometers traveled per period, or it’d establish different rates depending on the traveled distance.
Once established the service level, there are other two variables that need to be established: the vehicle’s brands and equipment, and the maximum traveled distance in order to calculate the fleet’s cost or budget for the studying period. The higher the traveled distance limit is, the lower is the budget for the vehicle’s acquisition, and on the contrary, the higher the budget for the vehicle’s acquisition, the lower must be the traveled distance limit.
Once established the vehicle’s brands and equipment, and the maximum distance to travel, one can calculate the variable operational costs and the residual value using the maximum distance limit, obtaining the values for direct costs and budget for the studying period. Some of the direct costs and residual values require an estimate or previsión.
If the budget wasn’t met, it’d be needed to choose other vehicle’s brands and/or models and establishing the maximum distance to travel, and have to check again if the budget would be met. If none of the solutions meets the budget, then one has to go back to the previous phase of establishing the service level and number of vehicles. If the vehicle fleet meets the budget, the next phase is acquiring the vehicles.
It needs to be proven that a better solution doesn’t dominate the chosen one, if m is the optimal number of vehicles of the chosen solution, then the service level and its associated costs will be calculated for m -1, -2, -3 vehicles and will compare it to the chosen solution, if said solution is dominated by a better one the last will be chosen.
References
Zhaolin Li, Feng Tao. 2010. On determining optimal fleet size and vehicle transfer policy for a car rental company. Computers and Operation Research. 37, 341-350.
 I´m a Fleet Management expert, and the manager of Advanced Fleet Management Consulting, that provides Fleet Management Consultancy Services.
