At some point during the life of a truck, the cost to keep it exceeds the cost of a new one. While there are other good reasons to replace a truck, the primary evaluation considerations should be economics.
There are four economic aspects to consider when evaluating the vehicle lifecycle. Before we cover those items, we must first understand some underlying assumptions about the equipment.
The underlying assumptions
Before we can adequately analyze the economics and the cost components, it is important to understand the following underlying assumptions:
Measure value
What value does your equipment provide? The lifecycle cost to replace a unit is always divided by value the unit offers. The most common measures of value include mileage, hours of operation, trips, or ton-miles.
Some examples include commercial carriers who sell tons of a class of freight for a certain number of miles. Taxi cabs sell by the trip, plus the mileage and waiting time. Other businesses are paid for by the trip, for just being there (known as standby power). These are all different methods for measuring the value provided.
Projected life
Projected life looks at the average lifespan of the entire fleet’s vehicles or sets a target lifespan for the vehicles. For example, replacing trucks when they reach 700,000 miles.
Suitability
Suitability, which can also be referred to as comparability, includes capacity, agility, time-saving features, robustness, safety, and availability.
In this article, assume the suitability of the two units is the same, and just compare the old unit to a potential replacement.
In today’s rapidly changing technology environment, new units might have features that make them much more suitable for your operation’s use. For example, if you are scheduled to replace some dry van trailers and you are traditionally cube limited, a 53’ trailer is more suitable then a 40’ trailer. A direct comparison of the two trailers would have to take the higher capacity into account.
Sensitivity
Replacement models show sensitivity to one or more inputs. Sensitive inputs include interest rates, diesel prices, utilization, and projected life.
- Usage (mileage or hours) – Higher estimates for usage will skew the results toward lower operating cost units. Low utilization estimates will skew away from high fixed-cost units.
- Interest rates – High rates will favor lower initial investment. In turn, this can lead to higher operating and maintenance costs.
- Fuel costs – High fuel costs favor high-efficiency and lighter-weight units. Lower fuel costs encourage buying more horsepower.
For example, the price of diesel has been stable around $3.25 per gallon in the U.S. But, if we look at the last ten years diesel costs have varied as high as $4.12 per gallon and as low as $1.99 per gallon. Another example: The interest rates over the previous few years have ranged from 3.5 percent to 5.5 percent and are trending lower as this is written. These variations make modeling accuracy difficult.
The economics: Four cost areas
After evaluating the operational fitness of the unit based on the assumptions above, there are four cost areas to consider when completing equipment replacement analysis.
Ownership costs. Ownership is the initial cost of vehicle operation. These costs start to accumulate after you acquire the unit, before the truck is even driven. These costs are payable even if the unit earns no revenue. When calculating ownership costs, fleets should consider the following:
- Purchase costs, depreciation, and costs of money
- Lease/rental payments (fixed portion)
- Insurance costs, self-insurance reserves (opportunity costs)
- Permits, license costs, statutory costs (costs mandated by law)
- Make-ready costs, new/used vehicle preparation
- Actual cost of time and resources shopping for vehicles
- Re-build/re-manufacture costs
- Labor to strip parts off retiring units
The highest ownership cost for vehicles is depreciation. Depreciation is a tax law concept to recover the investment as it deteriorates. The calculation is regulated by law and does not reflect actual values. Real depreciation is higher right after purchase and drops to minimal levels over the years.
Here’s a simplified example to calculate ownership cost. We want to buy a vehicle that costs $75,000 (all-in) to purchase. After eight years, we’ll estimate the salvage value at $18,000. The $57,000 difference equals the overall amount paid for the vehicle itself.
Add $4,000 in annual costs such as insurance, licensing, etc. over the eight years the vehicle is in the fleet, and that equals an additional $32,000. The total cost of the vehicle itself along with the additional annual costs totals $89,000.
The vehicle travels an average of 75,000 miles per year. Over the course of eight years, this totals 600,000 miles.
To calculate the cost-per-mile of ownership, divide $89,000 by the 600,000 miles, which totals $0.148 per mile for ownership costs.
Operating costs. Operating costs vary by the use of the vehicle. Reduction in mileage through better routing, reduced idle time, proper tire inflation, and preventive maintenance that corrects bearing/drivetrain/clutch issues, will all favorably impact operating costs. The unique aspect of operating expenses is that they respond immediately to improvements in your operation. Consider these operating costs within your fleet:
- Fuel prices
- Fuel taxes (above those paid at the pump)
- Mileage charges on rental and/or leased units
- Tire consumption (not repairs)
- Adding vehicle fluids such as engine oil, coolant, hydraulic oil, etc.
- Other miscellaneous operating costs
Here is another example of how to calculate operating costs per mile. Our proposed purchase is a diesel-powered unit that gets 10 miles per gallon. Fuel cost with tax totals $3.75 per gallon. This calculates to $0.375 per mile. Then, consider tire costs. If we estimate a tire has 37,500 miles of road life, and a straight van truck has 10 total tires at a cost of $275 each, the tire cost would total $2,750. That total cost, divided by 75,000 miles, totals $0.04 per mile. Adding the fuel and tire costs totals $0.41 per mile. See Fig. 1 for another comparison.
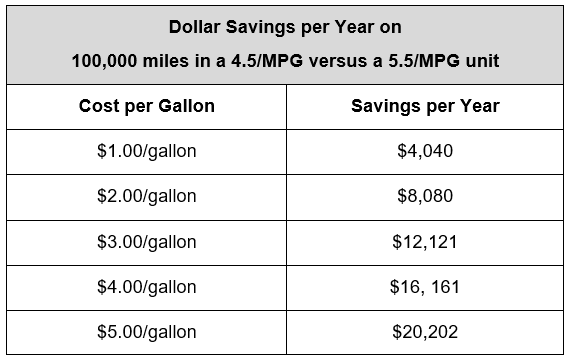
Fig. 1: Dollar savings per year comparison
Maintenance costs. As part of operating cost calculations, maintenance costs should be considered. Maintenance costs include all scheduled and unscheduled services and repairs, such as:
- The actual cost of inside labor (includes fringes, lost time, and overhead)
- The actual price of inside parts (consists of a fee to carry, spoilage, etc.)
- Outside labor (vendors)
- Outside parts (suppliers)
- Changing oil and coolant
- Road calls (accidents, fuel, mechanical breakdowns, tire issues, etc.)
- Hidden costs of failures
Maintenance costs generally start high, but most are covered by warranty. This is the shakedown period when latent defects may surface. After a year or so the costs stabilize to a lower level. As the unit ages, the maintenance costs start to increase as larger components reach their end of life. We may try to replace the unit before the inflection point when the costs escalate rapidly.
Maintenance costs for a unit of this type might average $0.10 per mile over the eight years. If you have repair data from your own operation, you can better estimate expenses from actual data. Note that in the U.S., parts costs have gone up faster than overall inflation. Labor rates have been stable, but indications are that they are also going to increase (due to localized skills shortages and full employment). These considerations may also increase maintenance costs each year.
Downtime costs. Downtime costs are highly dependent on the consequences of a breakdown or of not having a unit when you need it. Even if we are comparing the same basic truck body in two services, this might require very different downtime rates.
For example, compare downtime costs consequences (or cost) for the same basic chassis that may be upfitted for numerous applications such as an ambulance, a light duty delivery van, an armored vehicle carrying jewelry to a convention, or an airport passenger van.
You also want to assess how much risk of vehicle downtime you can tolerate. The more risk tolerance, the lower the downtime cost and the longer a fleet might be willing to keep the vehicle. Below are some considerations when calculating downtime costs:
- Idle operating times (including driver’s salary)
- Replacement unit rental costs
- Load replacement cost for damaged or destroyed freight (time-sensitive loads like vegetables)
- Late penalties
- Increase in cargo insurance premium, in case of an accident
- Loss of early/on-time incentives
- Intangible costs of customer dissatisfaction, hidden fees, other charges
- Revenue loss
- Cost of tied-up capital
These costs can be used to calculate downtime cost per hour, cost per trip, and cost per field repair incident.
Low downtime estimates are $100/hour; high downtime estimates might be $1,000/hour. Note that road calls can easily exceed $1,000. More significant problems include damage and delays to the freight, perishable loads, or contractual liquidated damages.
Downtime is only chargeable for the hours that the unit is in demand. Many organizations that operate during one shift can reduce downtime by using second or third shifts for preventive maintenance (PM) and small to moderate-sized repairs. Where this is possible, many of the costs associated with scheduled – and some of the costs of breakdown downtime – are eliminated.
Putting it all together
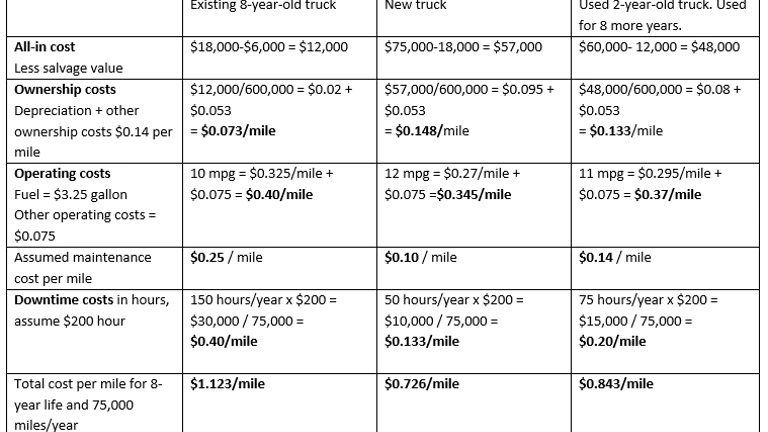
Before everyone starts disagreeing, realize that changing the assumptions changes the result. Consider using the calculations here to set up in a spreadsheet and check the sensitivity for changes in all the variables. See Fig. 2 for an example.
You’ll find some numbers move the needle quite a bit and others not so much. Focus your analysis on setting up the parameters, and you’ll have a handy tool.
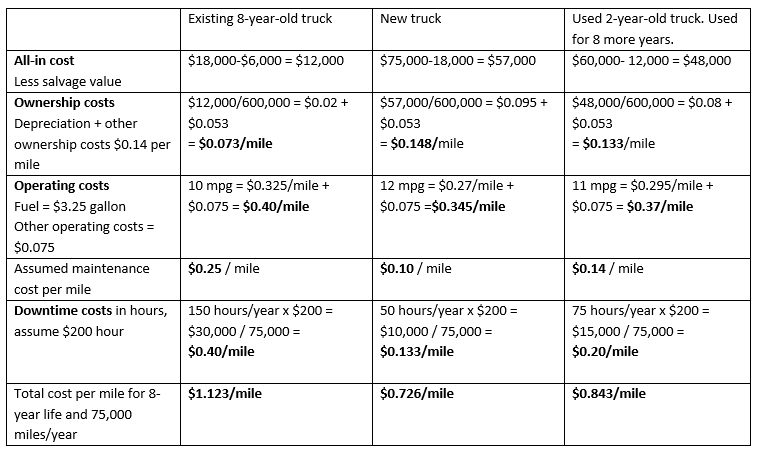
Fig. 2: Comparison of total cost per mile for vehicles in different stages of their lifecycles.
By Joel Levitt
Source: https://www.fleetmaintenance.com
CUT COTS OF THE FLEET WITH OUR AUDIT PROGRAM
The audit is a key tool to know the overall status and provide the analysis, the assessment, the advice, the suggestions and the actions to take in order to cut costs and increase the efficiency and efficacy of the fleet. We propose the following fleet management audit.

