Testing Times: How fleets are faring from the switch to WLTP
Two years into the transition to the tougher WLTP fuel economy test, and there are few signs that the dust is settling. Alex Grant reports.
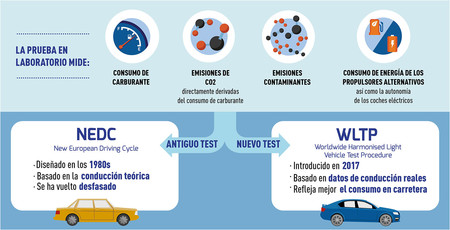
On the 1 September 2017, Europe’s automotive industry began a disruptive but necessary shift. The Worldwide harmonised Light vehicle Test Procedure (WLTP) introduced a more stringent laboratory fuel economy test cycle for new vehicles, aiming to close the gap between published figures and real-world efficiency.
A gap which, according to Transport & Environment, had reached 42% by the time the new cycle was introduced.
But change, it seems, hasn’t come easily. Manufacturers were required to re-test every engine, trim and variant in their range, and contingency measures haven’t smoothed the transition. The outgoing New European Drive Cycle (NEDC) lives on, either via an optional physical test or computer-generated ‘NEDC Correlated’ figures, to produce comparable data for forthcoming EU-wide CO2 targets. NEDC Correlated figures haven’t lived up to their name.
“It certainly caught the industry by surprise,” says Matthew Walters, head of consultancy and customer data services at LeasePlan UK. “We saw many manufacturers quickly pull certain vehicles from sale so these engines could be tested under the new regime. Many ultra-low emission vehicles – under 75g/km CO2 – lost this status overnight, affecting capital allowances and congestion charge status amongst others. This has led to problems with supply, with vehicle slots suddenly being cancelled. We had to switch drivers into different cars.”
Short deadlines didn’t help. All except run-out models had to be re-tested within 12 months, with manufacturers either completing the process early or prioritising big-selling vehicles or variants ahead of the 31 August deadline. SMMT data showed a 20.5% drop in year-on-year registrations during September 2018, citing disrupted supply as a major factor. Many slower-selling vehicles and variants were withdrawn, and some still haven’t returned.
This is prevalent among plug-in hybrids. The WLTP introduces a ‘utility factor’ based on the share of the overall test cycle carried out on battery power, essentially giving a bigger CO2 advantage for vehicles which are more likely to be driving in electric mode. However, the tougher test both shortens the electric range and results in higher fuel consumption once that range is exhausted, which has pushed some vehicles over 50g/km.
That’s a significant step, because 50g/km is the cut-off point for financial incentives in some markets, and it’s the upper limit for the European Commission’s definition of a low-emission vehicle. These are counted twice when calculating average CO2 emissions in 2020, and 1.67 times in 2021, so can make a big difference when pushing for the 95g/km target in 2021. Full model changes for big-sellers, and supply disruption during upgrades and re-testing for others, has had a big effect. In the first half of 2019, SMMT data shows plug-in hybrid registrations had halved compared to the same period in 2018.
But manufacturers are learning and, with commercial vehicles going through the same process 12 months later, ALD fleet consultant Mark Evans expects less disruption: “Better data has been available in terms of factory ordering and vehicle availability between NEDC and WLTP production. Many manufacturers have increased stock and, to some extent, the increase in commercial vehicle deliveries year to date can be linked to forward planning and ordering by fleet operators who have been better prepared,” he says.
Commercials have their own challenges, though. WLTP produces more granular data, incorporating the effects of optional equipment such as larger wheels, body kits and panoramic roofs on fuel economy. SEAT, for example, has responded with a simplified range that reduces options to avoid complexities with CO2 figures under the new regime. But ICFM director, Peter Eldridge points out that this isn’t as easy with commercial vehicles – particularly third-party van converters.
“Each of these vehicles needs to meet WLTP regulations. To that end van manufacturers are reportedly creating web portals where converters can input the key criteria of their conversions and an online tool will produce the relevant WLTP emissions and fuel economy figures based on the converted vehicle,” he says.
Forward planning has also been tough. NEDC Correlated brought overnight CO2 rises as vehicles were re-tested, with corresponding tax hikes for fleets. Combined with declining diesel demand, the BVRLA’s Q1 2019 quarterly leasing survey showed CO2 emissions for leased cars averaged 118g/km – a five-year high, and a 7% rise since Q1 2017. Despite HM Treasury announcing a two-band reduction in Company Car Tax when registrations switch to WLTP CO2 figures next April, Nick Molden, founder and CEO of Emissions Analytics, says today’s data isn’t transparent.
“WLTP CO2 figures are not easy to find, although you can estimate from the published MPG figures,” he explains. “And the NEDC-equivalent figures are even harder. The OEMs also have the choice whether they retest on NEDC, use the CO2MPAS translation tool or declare a value. They are not all correlated using CO2MPAS. All in all, the information is neither easy to find nor easy to interpret.”
So the dust has yet to settle, though fleets are starting to adapt. The 2019 Arval Mobility Observatory, which studied 3,930 operators, found roughly one in six were adjusting choice lists to cope. Most of those (12% of the total) were opting for lower-emission cars, 7% were adopting alternative fuel vehicles, while 4% were reducing the category of cars on offer.
“The calculations and the knowledge needed to do this successfully are quite involved and even some large organisations with good internal fleet resources need to look to external consultants to be able to handle the challenge successfully,” comments Shaun Sadlier, head of the observatory in the UK.
“Certainly, several customers with whom we have been working are now introducing vehicles that perform better under the new test, including hybrids and EVs. Our general finding is that, in most cases, new choice lists can be created that resolve most of the issues raised by the switch to WLTP and it is helping some fleets move more quickly towards the wider fuel diversity we expect to see develop over the next few years.”
A cure, or a new problem?
WLTP is designed to close loopholes in the NEDC, but a recent study by Emissions Analytics suggests it isn’t infallible. The company’s EQUA Index includes real-world emissions data for vehicles dating back to 2011, and it hasn’t changed since. In turn, this enabled it to provide a baseline for analysing groups of vehicles which had been tested under the NEDC and WLTP.
Based on EQUA Index data, NEDC-tested petrol cars emitted an average of 182g/km, versus 172g/km for the diesels, while WLTP-tested cars emitted 185g/km and 173g/km respectively. But the published figures tell a different story.
WLTP appears to have closed the gap between ‘real-world’ and laboratory testing for diesels. Published average CO2 climbed from 124g/km under the NEDC, to 175g/km under the tougher WLTP. NEDC Correlated was in the middle, at 143g/km. But petrols were anomalous, averaging 152g/km under NEDC, and falling to 151g/km under WLTP conditions or 133g/km for NEDC Correlated.
“We predict that, when it settles down, WLTP will still underestimate by 15-20%,” says Molden. “The cycle still isn’t real-world enough, so there will be a hiatus of two or three years where the numbers will be all over the shop, then it will settle down. But we think there will still be a distinct problematic gap between WLTP and reality.”
Are tax reforms adequate?
Consumer contact with the NEDC ceases on 6 April 2020, when new registrations switch to a WLTP CO2 figure. In July, HM Treasury announced a two-band reduction in Company Car Tax for vehicles registered after this date, to account for the higher CO2 emissions produced under the WLTP, and it’s not a moment too soon. Recent HMRC figures suggest 80,000 fewer people paying Benefit-in-Kind on a company car in 2017/18 versus the previous year – a 5.3% decline, attributed to them becoming less financially attractive.
Clarity will be welcomed, as will long-overdue incentives for electric vehicles which arrive on the same date, but early WLTP figures suggest there could still be problems ahead. The new BMW 318d Sport, for example, emits 112g/km under the NEDC conditions, so cars registered until 5 April 2020 will fall into the 30% tax band. Register the same car on the 6th April and it will be taxed based on its WLTP CO2 figure – 138g/km. Even with the 2%-point company car tax reduction, it falls into the 34% band.
ICFM chairman, Paul Hollick doesn’t believe it goes far enough. “Through its own company car benefit-in-kind tax strategy [the Government] is undermining one of its major policies – driving fleets towards a zero-emission future,” he says.
Trained on Cardiff University’s renowned Postgraduate Diploma in Motor Magazine Journalism, Alex is an award-winning motoring journalist with ten years’ experience across B2B and consumer titles. A life-long car enthusiast with a fascination for new technology and future drivetrains, he joined Fleet World in April 2011, contributing across the magazine and website portfolio and editing the EV Fleet World Website.
Source: https://internationalfleetworld.com
FLEET MANAGEMENT AUDIT
Fleet management is the use of a set of vehicles in order to provide services to a third-party, or to perform a task for our organization, in the most efficient and productive manner with a determined level of service and cost.
Fleet management activities are shown in the following graph 1:

Graph 1: fleet management activities
The proposal audit analyses and assesses all fleet management activities shown in the graph 1, and its main goals are:
- Know the overall status of the fleet management activities
- Provide the analysis, the assessment, the advice, the suggestions and the actions to take in order to cut costs and increase the efficiency and efficacy of the fleet management activities
With the information obtained, we’ll elaborate a report that holds the overall status of the fleet management as well as the suggestions, recommendations and the measures to take in order to cut costs and optimize the fleet management activities.
CLICK ON THE FOLLOWING LINK TO DOWNLOAD THE PROPOSED FLEET MANAGEMENT AUDIT:
Fleet Management Audit AFMC
Contact:
José Miguel Fernández Gómez
34 678254874
info@advancedfleetmanagementconsulting.com


