FLEET´S INFORMATION SYSTEM
The organization has to design and establish the information system for the fleet with the following goals: to know the current state and tendency; to control and optimize the activities and the service level; to control and reduce costs; to control and monitor the vehicles; and to collect important data needed to make decisions.
Join to The Fleet Management Group
 In this group, you can know and share knowledge, experiences and meet people interested in Fleet Management over the world. Each week we publish posts, conferences, news, scientific papers, and technology related to Fleet Management.
The fleet management group
The organization has to establish what information to collect and how often it needs to be collected, depending on the following factors.
- Fleet’s importance.
If the vehicle fleet is the main activity of the organization, the information system has to be complete and developed, on the contrary if the vehicle fleet is a secondary activity, it’d be enough to have a basic information system
- Organization’s activities.
Depending on the organization’s activity, the information needed is different. A package transportation company needs a different information system and indicators than a company whose vehicles are used by sales associates
- Fleet’s activities.
The information system has to be more complete and developed in those activities of high added value, and use the most resources in the fleet
- Level of control and analysis.
If the information level of control and analysis is high, it’d be required to collect information more often, and the information system has to be more complete and developed
- Cost
The more the information to collect, analyze and its collecting frequency, the more human and technical resources needed, for which the costs are higher
Part of the vehicle fleet’s information system is supplied with information from other departments like accounting.
The information is divided in two types depending on when it’s collected
- The information is collected in the moment it’s produced, and corresponds to discreet events. For example, when a vehicle is acquired, it has to be collected the cost of acquisition, the date, the model or equipment. When a vehicle is refueled, it has to be collected the amount of fuel, date, cost and kilometrage/mileage, if the vehicle doesn’t have a devise (telematics) that measures the fuel consumption.
The organization has to establish the frequency to calculate the amount of these events in a set period of time like weekly, monthly or yearly. For example, the number of traffic accidents during a week, the number of planned maintenance per month, the number of vehicles acquired a year, or how many kilometers a traffic accident, maintenance or breakdowns happen.
- The information is collected with a frequency that has to be established by the organization, and corresponds to continual variables like distance traveled, or fuel consumption, if the vehicle has a device that measures the fuel consumption.
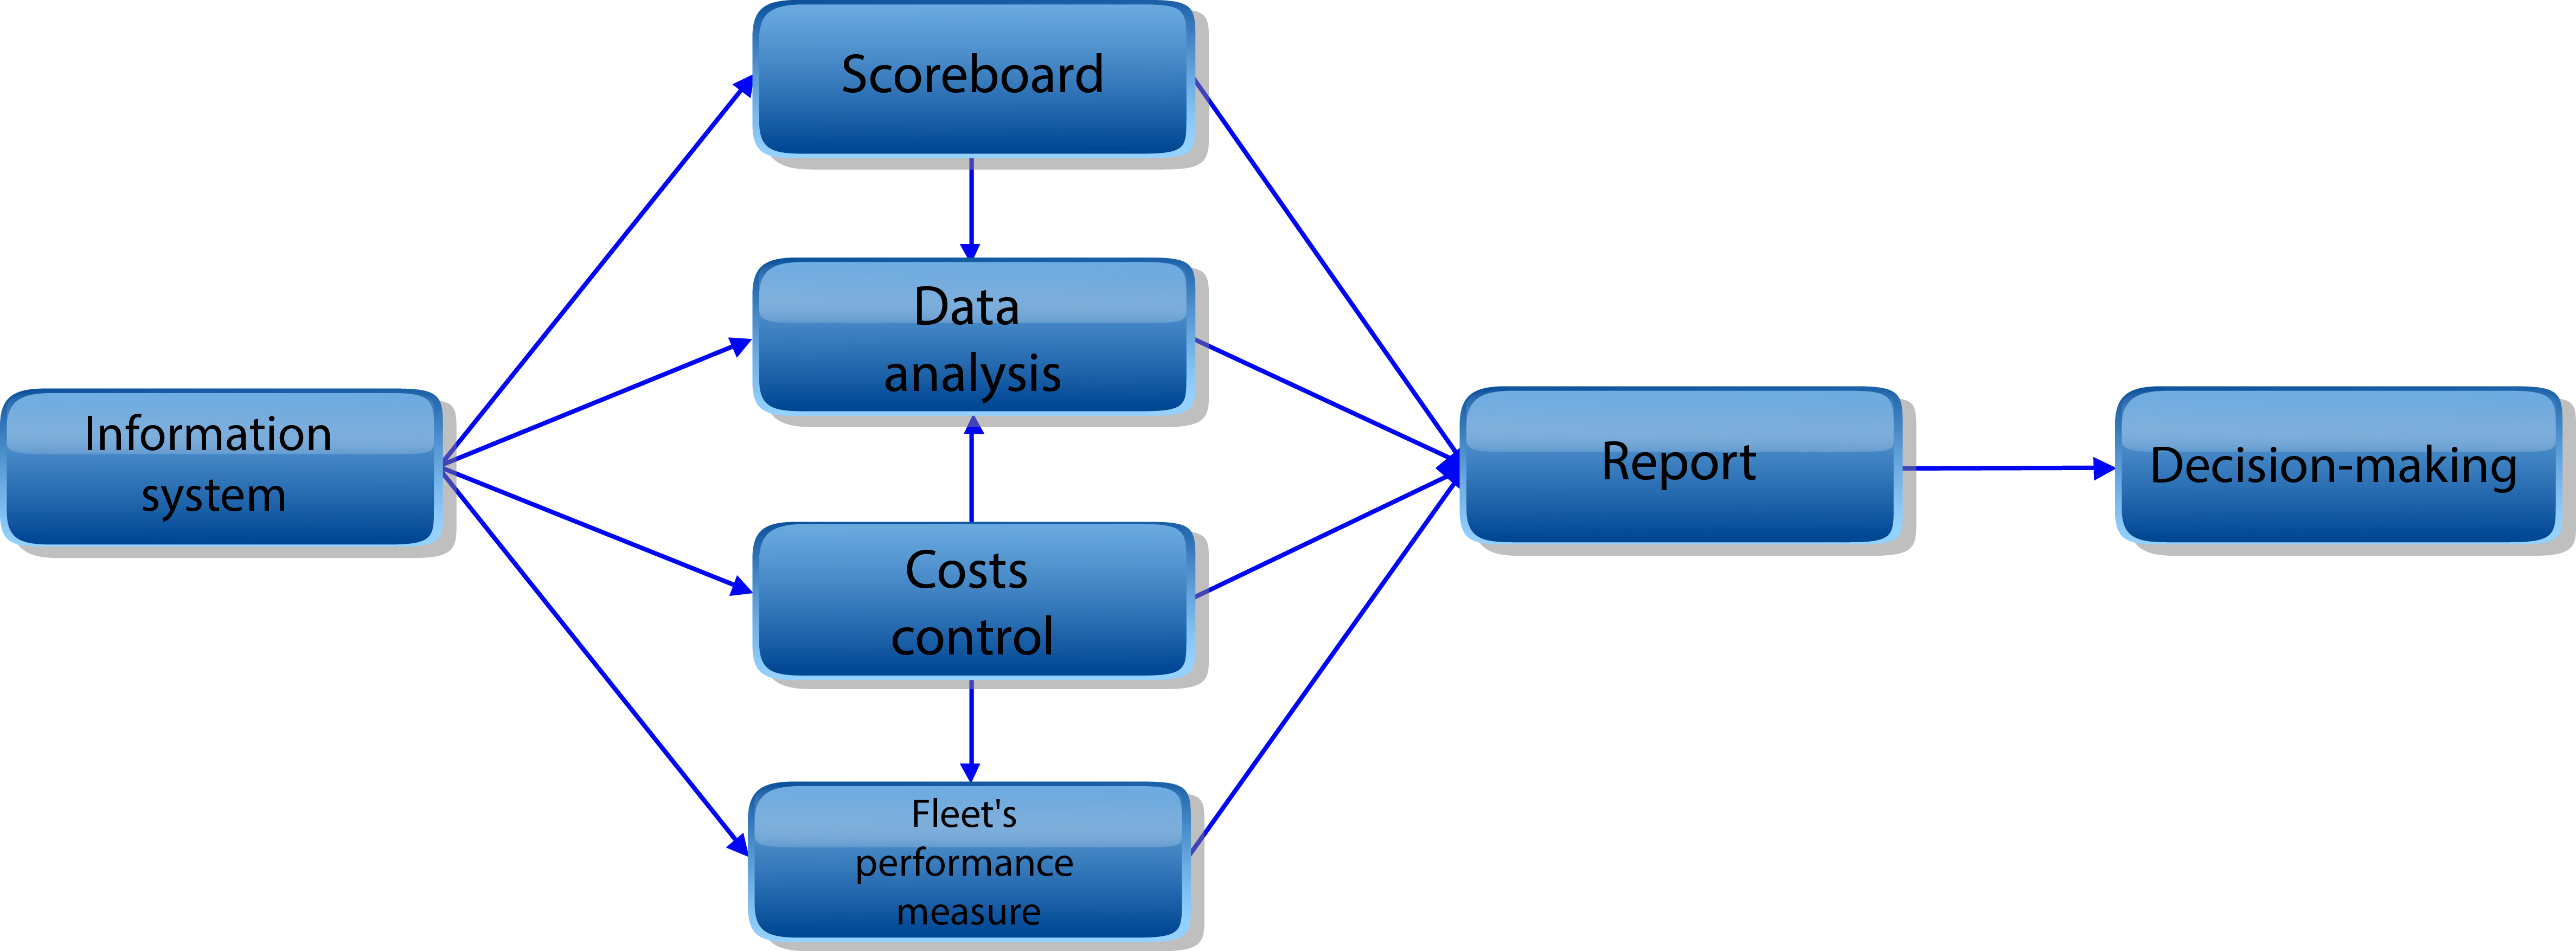
The information system supplies the information needed to develop each one of the following tools: scoreboard, data analysis, cost control, and measuring the fleet management performance.
With the results obtained from each of these tools, it can be done: the general report for the organization management, which has to establish the frequency to do said report. It’s recommended to do it every three months, every semester, or yearly, depending on the organization’s characteristics and goals. The tools mentioned before are also needed for decision-making and measures to take over the fleet management, like shown in the graph 1.
Graph 1: information system for vehicle fleet management.
Vehicle fleet’s scoreboard
The scoreboard is a fundamental tool in fleet management, and allows the organization to know and do the adequate control and monitor of the most important information in the fastest, simplest way possible. The scoreboard is made of several indicators that are calculated and/or collected from the provided information by the information system.
It has to be considered that a very wide scoreboard with several indicators could be an obstacle for the fleets operation because of the amount of information that needs to be collected and analyzed; on the contrary, a scoreboard with very few indicators won’t provide all the information needed for its management.
For this reason the organization has to establish the appropriate number of indicators, and which ones are the most valuable that adapt better to the organization’s characteristics, operative, budget and goals.
For example, a basic scoreboard has the following indicators: traveled distance, fuel consumption, number of vehicles that haven’t complied with the planned maintenance, the status of the vehicle (available, unavailable), the number of accidents and the service level.
The organization has to establish the frequency for the general report of the scoreboard, which is advisable to be done monthly. In order to do this, the information system’s indicators have to be calculate/collected.
For example, if the traveled distance (km/ml) is collected weekly in the information system, all the data would have to be added together for a month if the scoreboard is done monthly.
The scoreboard is structured in a shape of pyramid, at the top there are a few basic and generic indicators that can be used in any type of fleet, and as the pyramid goes down, the number of indicators increases, getting more specific and encompasses more activities of the fleet.
Implementing the scoreboard in an organization’s management requires a period to adapt, and for this reason it’s advisable to establish a basic chart as already explained in the first phase, and once consolidated, spreading the scoreboard to more specific indicators and activities.
The scoreboard report´s has to be simple and easy to understand, for this it’s recommended to use graphics and charts.
The information has to be presented from the most generic to the most specific, and by types of vehicles. If the organization has several workplaces available, in different geographic locations, a chart has to be done for the whole organization, and an individual one for each workplace.
There’s a variety of graphics and charts that represent the information for a scoreboard, following will be shown some examples if the vehicle fleet is made up of three types of vehicles.
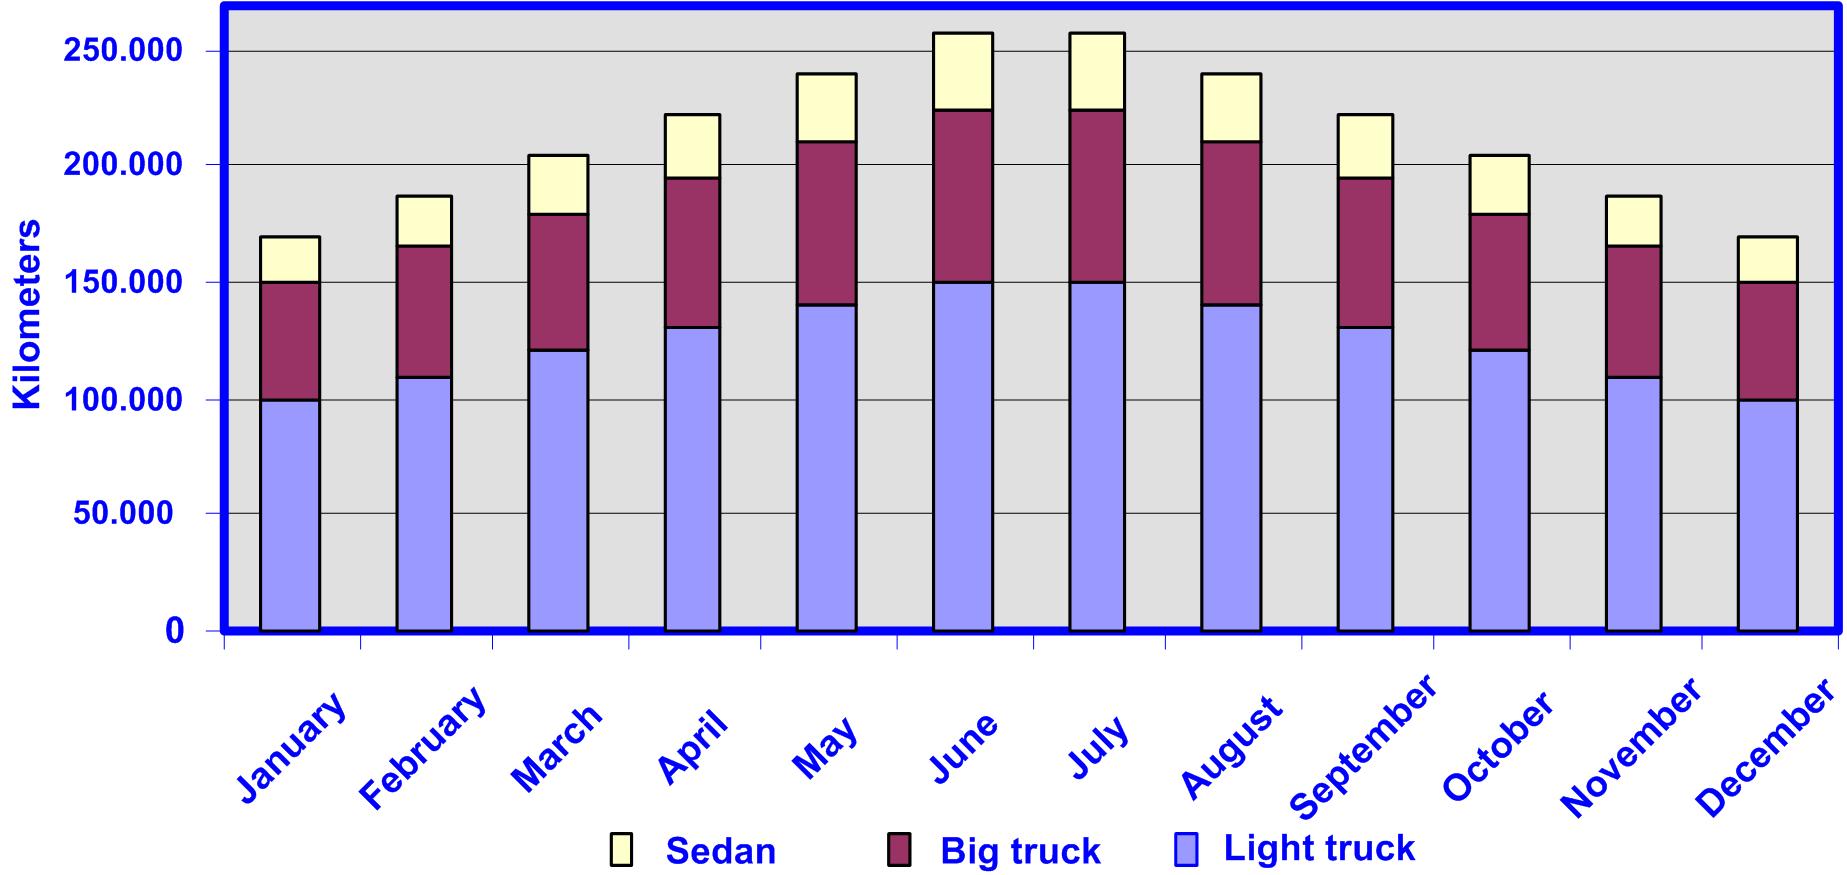
The graph 2 shows the total traveled kilometers per month and type of vehicle.
Graph 2: total traveled kilometers per month and type of vehicle
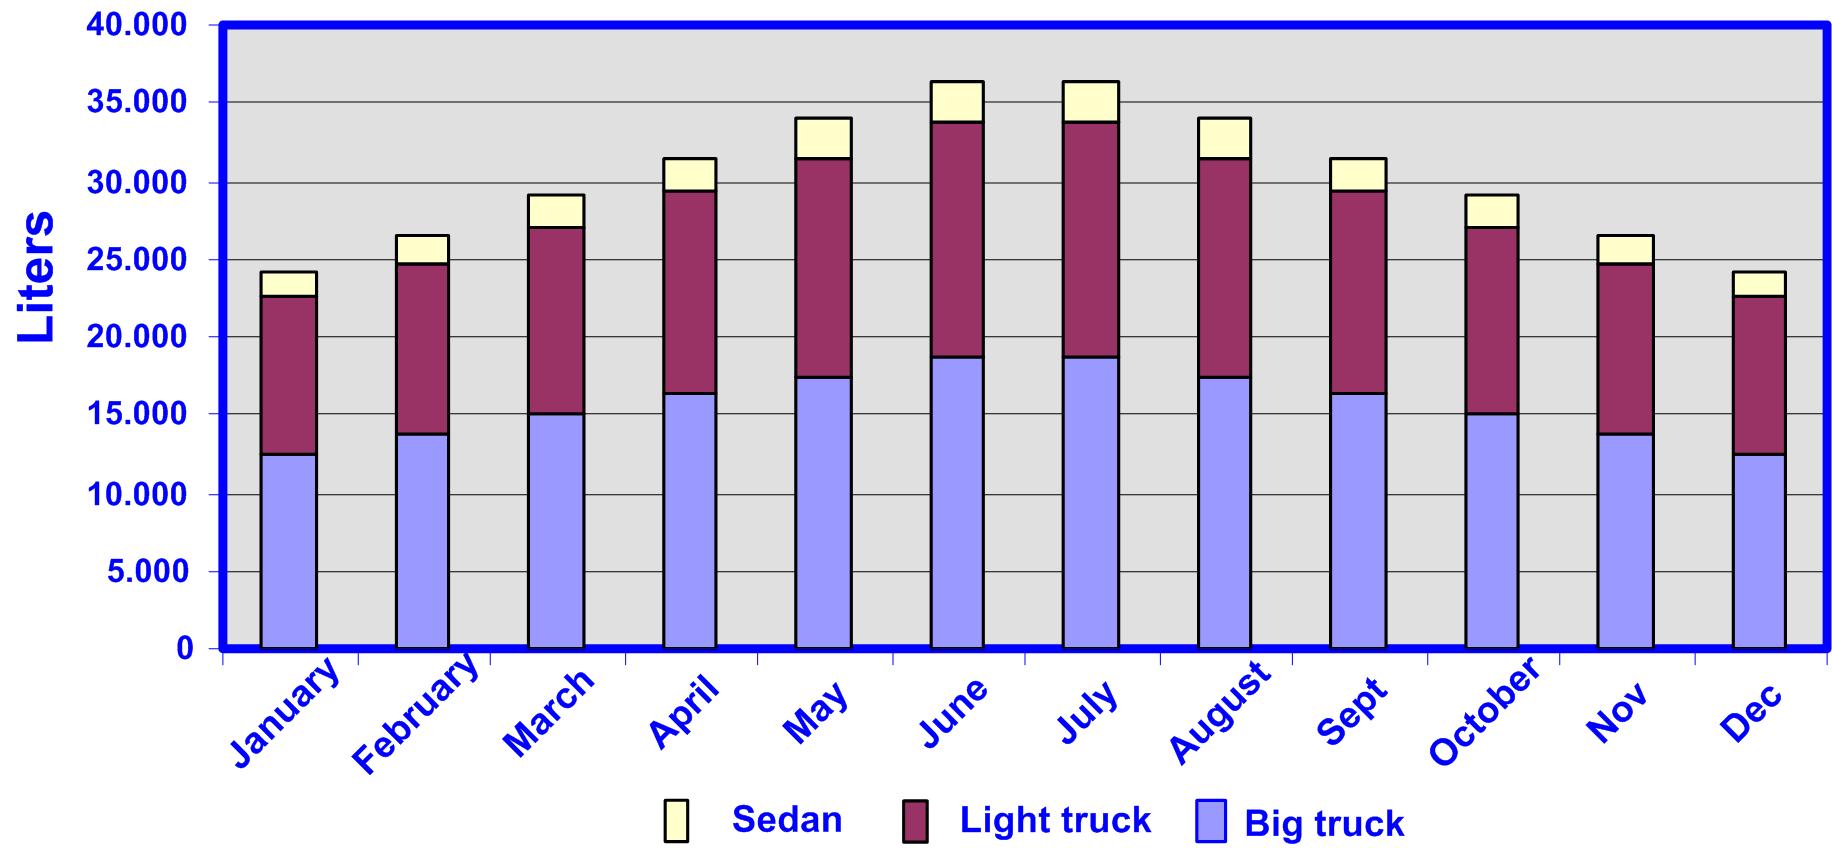
The graph 2 shows the fuel consumption per month for all the fleet’s vehicles, classified by type of vehicle. The graph for the Co2 emissions is similar to the one for fuel consumption because that calculation is based on the later.
The graph 3 shows the fuel consumption per month for all the fleet’s vehicles, classified by type of vehicle. The graph for the Co2 emissions is similar to the one for fuel consumption because that calculation is based on the later.
Graph 3: total fuel consumption per month and type of vehicle
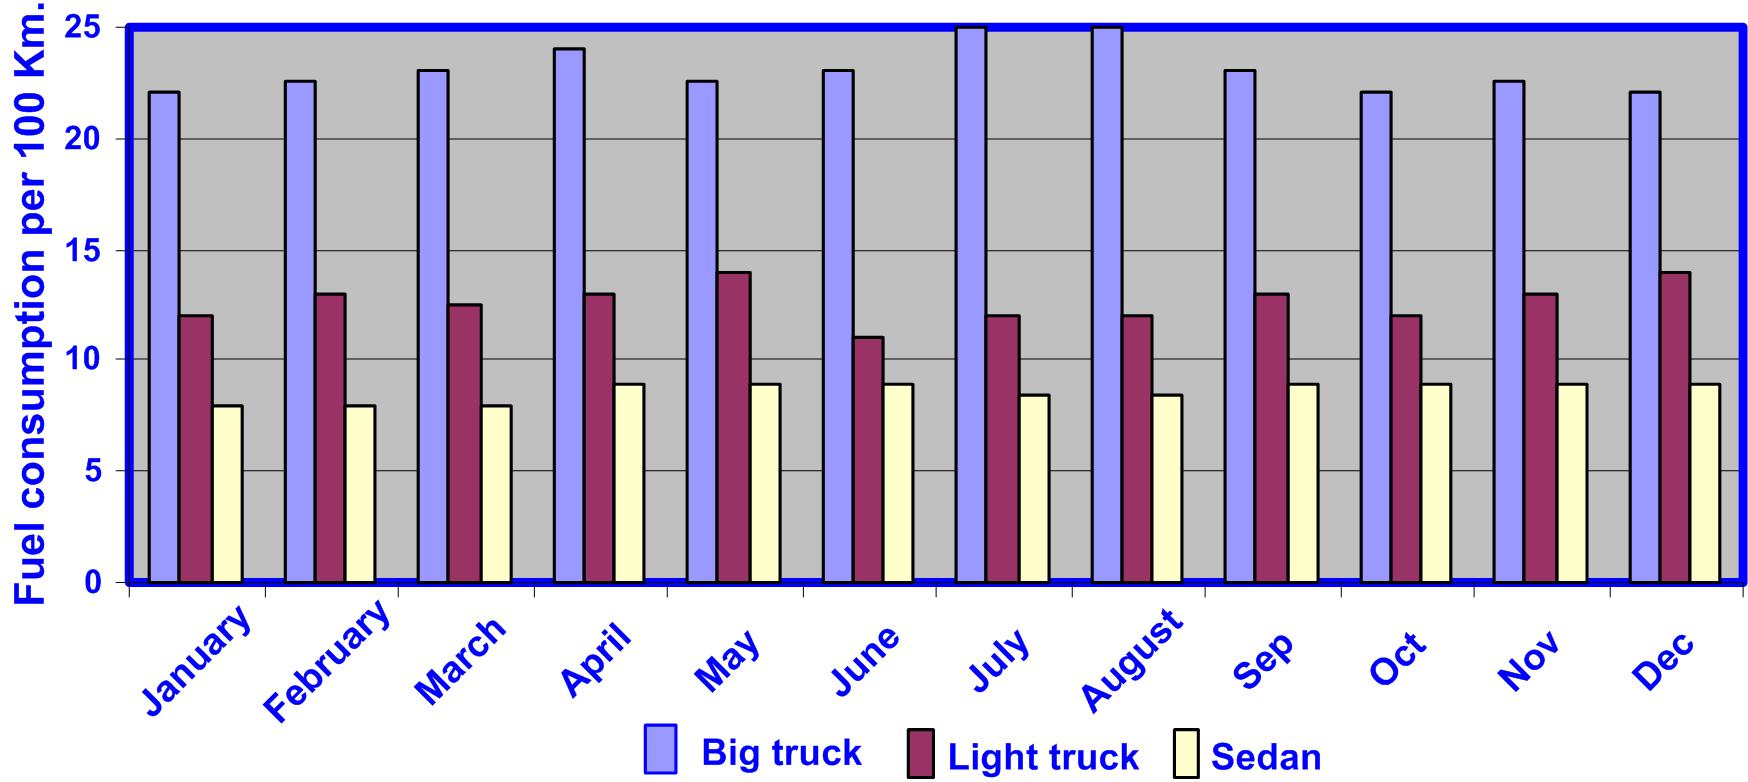
Having the traveled distance and the fuel consumption, it can be calculated the average fuel consumption per 100km, by type of vehicle, like shown in the graph 4.
Graph 4: fuel consumption per 100km.
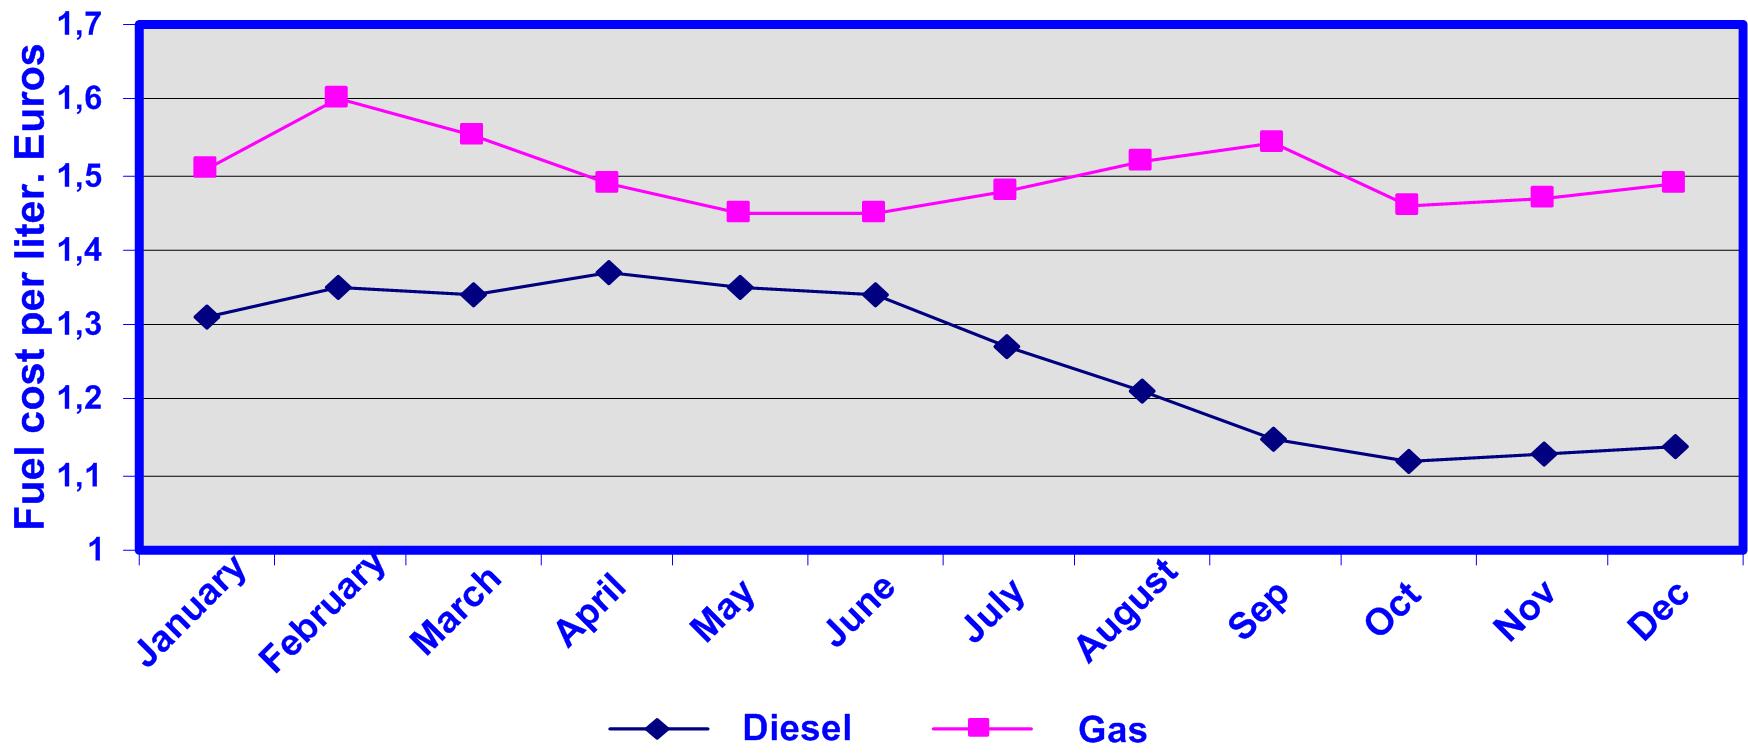
The graphic 5 shows the evolution of costs of price of fuel per liters, by type of fuel per month.
Graph 5: fuel cost per liter and type of fuel per month
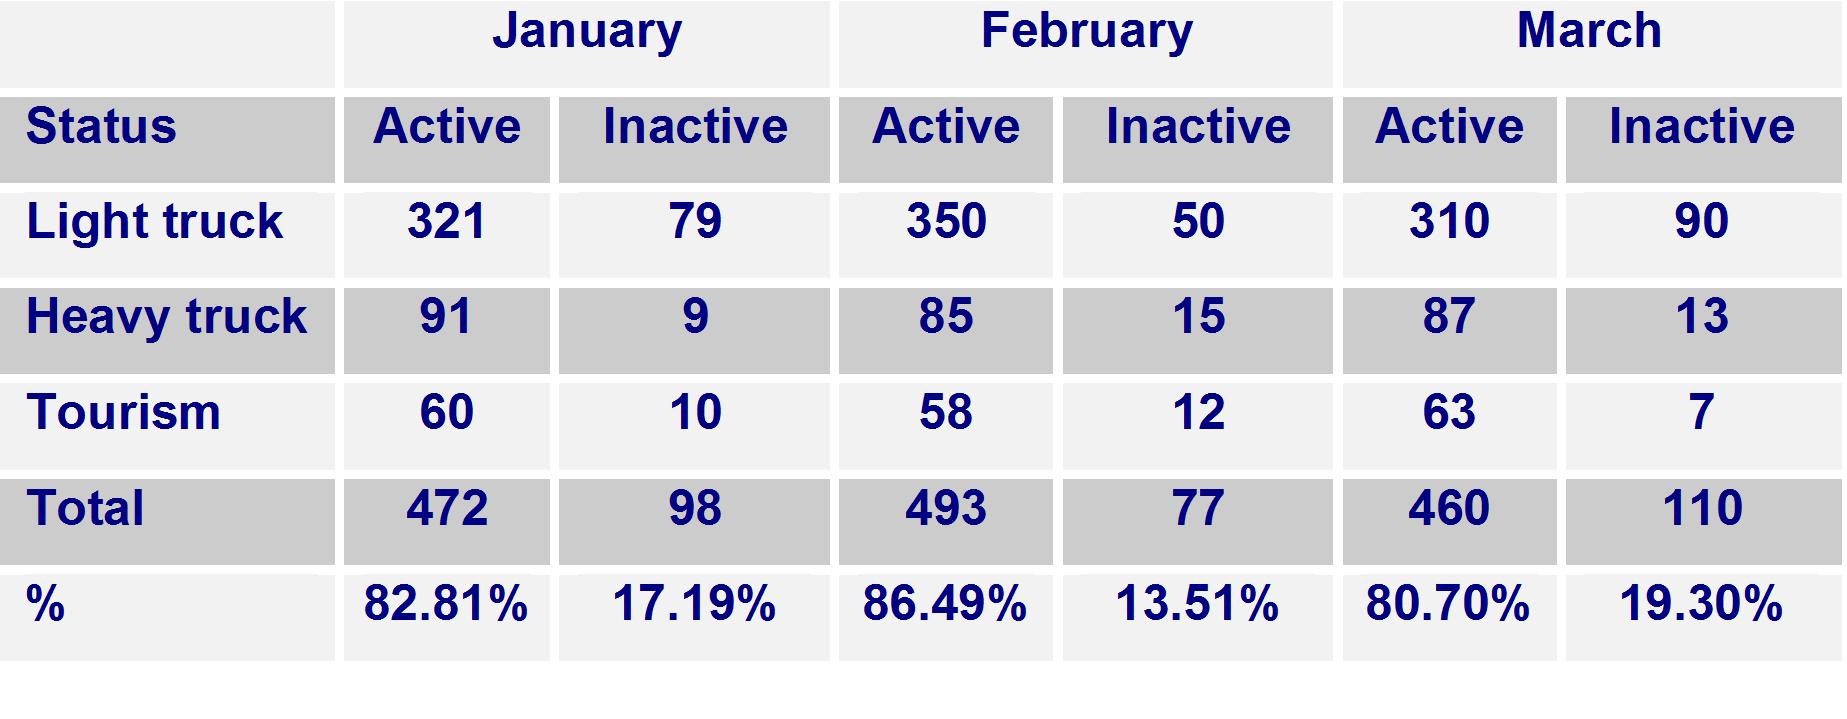
The status of the vehicle (available, unavailable) monthly, and per type of vehicle, if this data is collected weekly, it needs to be calculated the average status of vehicles of the weeks of the month.
Chart 1: available vehicle, unavailable vehicles
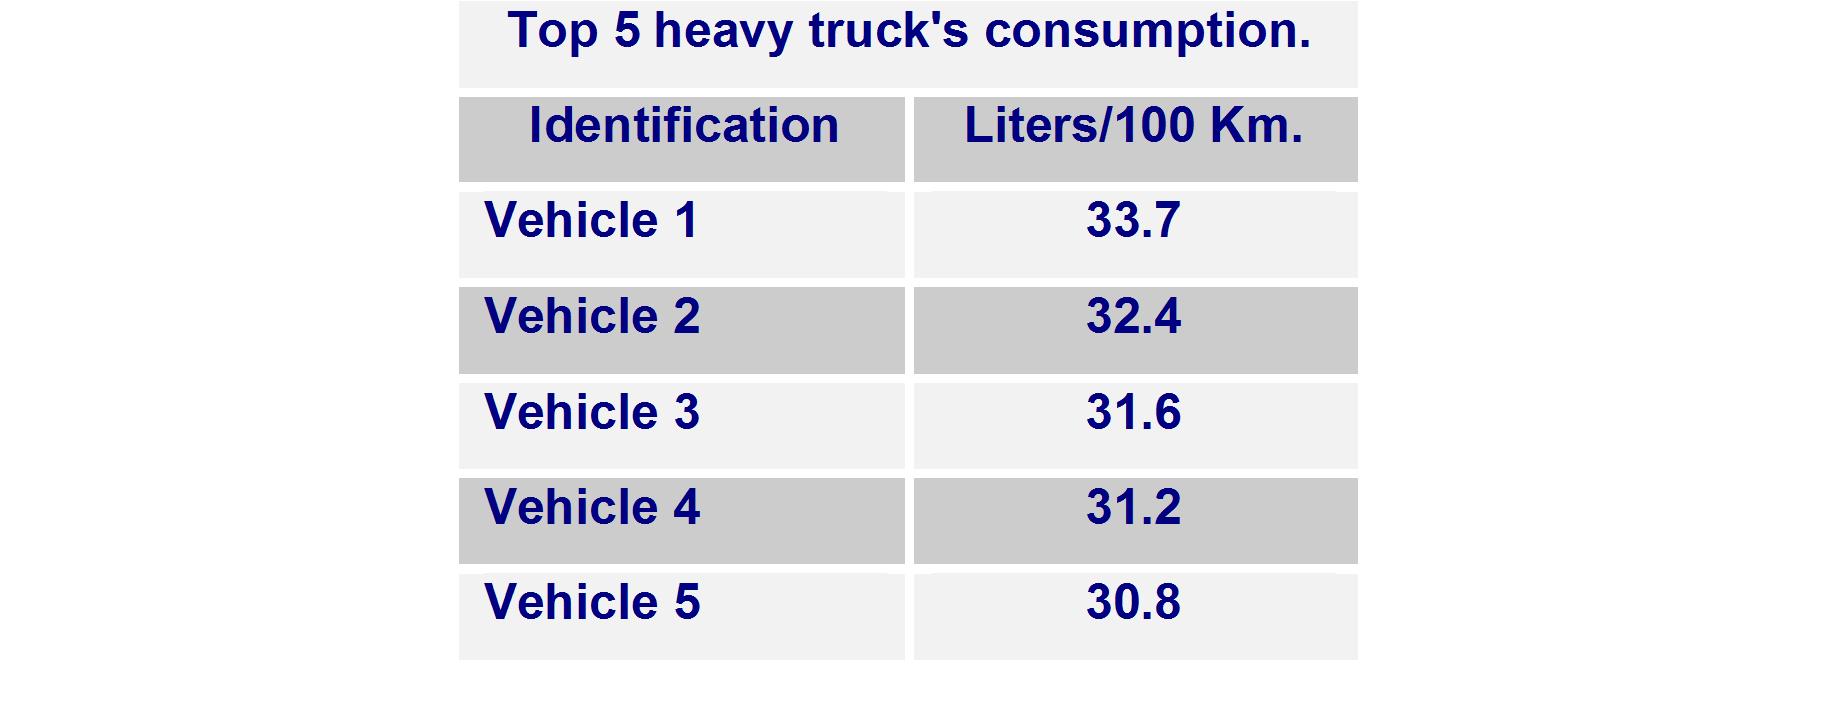
A ranking chart for type of vehicle, to represent the vehicles that consume the most, that contaminate the most, cost per kilometer, number of accidents, etc. The chart 2 shows that heavy trucks contaminate more.
Chart 2: top 5 heavy truck’s consumption
Vehicle fleet’s data analysis
The information provided by the information system has to be analyzed and studied deeply in order to obtain valuable information for decision-making; because of this, it’s advisable to use descriptive statistics, multivariate analysis or operational investigation techniques.
The organization has to establish a period in which the data analysis is done, and it’s advisable to do it every 3 months, every semester, or yearly, depending on the organization’s characteristics and goals.
Following are described some examples of some of the valuable information that can be obtained.
- Find behavioral patterns and take the needed measures so it doesn’t happen again. Examples of behavioral patterns are the following:
45% of traffic accidents are produced between 1-5pm, the average age of the driver is 28 years old, it’s a sunny day, and the type of accident is reversing into a parking space.
35% of the breakdown costs are determined by a vehicle model, in the transmission system, the vehicle has manual transmission, and travels through urban routes.
The drivers with higher fuel consumption are those that are 32 years old, have 3 years of experience, haven’t received any efficient driving courses, and drive recklessly.
- Classify the information by categories and by relevance.
Make an ABC analysis to classify the information by categories to detect the 20% of the events that produce 80% of the costs.
For example, the organization could know which are the main types of accidents or breakdowns that produce 80% of their costs.
- Find anomalies and misuse of the vehicles.
This information allows the company to find anomalies and misuse of the vehicles, in both cases the fleet manager has to find the reason why these situations are occurring and take the adequate measures. Some of the examples to do it are the following.
If a vehicle has the same kilometrage/milege for 4-5 weeks in a row, and it’s active, several things could be the reason why it’s not being used. It could have broken down or had a traffic accident, and they haven’t been reported yet, or there’s no one in charge of this vehicle. If the kilometrage/mileage information is collected weekly, finding this kind of anomalies is easier than if the information was collected monthly.
A driver refuels a vehicle, some of the fuel is used in the vehicles, and some is stored for his personal use, for which the cost per kilometer of fuel for this vehicle would have been much higher compared to its normal use.
If the organization uses telematics services, it could be identified if the vehicle is being used for personal use since it could be known what routes are being done, and if it’s used after working hours.
 I´m a Fleet Management expert, and the manager of Advanced Fleet Management Consulting, that provides Fleet Management Consultancy Services.

