Relation between the fleet´s cost and the service level
The organization has to design and implement policies concerning the calculation of the optimal number, service level, and costs of a vehicle fleet. These policies will depend upon the following aspects such as general strategy, market, offered services, competition, or the budget available for the organization.
Calculating the number of vehicles in a fleet is a complex task due to some aspects such as establishing the service level and the associate cost, planning the routes if they are available, what kind of vehicle to use and their capacities, using 100% of the vehicle’s capacity, the localization of the company’s headquarter; considering all this would lead to the optimal number of vehicles needed.
Join to The Fleet Management Group
 In this group, you can know and share knowledge, experiences and meet people interested in Fleet Management over the world. Each week we publish posts, conferences, news, scientific papers, and technology related to Fleet Management.
Theoretical and practical case study
The following is a theoretical and practical case study developed to show the relationship between the optimal number of vehicles, service level and direct costs. The case to analyse is a vehicle fleet that delivers and picks-up goods in certain locations, this case is chosen because it’s one of the most complex to analyse, and one of the most common in fleet vehicle management. In order to make the case as simple as possible, the only direct costs are vehicles acquisition, drivers’ salaries and fuel costs.
Consider that packages have to be delivered or picked-up at locations A, B, C, and D, which are uniformly distributed around a circle’s circumference with a radius R. The only factual solutions to locate the base (O) are: the center of the circle (case A), or in one of the delivery locations (case B), for this reason a delivery location is eliminated, graph 1 represents both solutions.
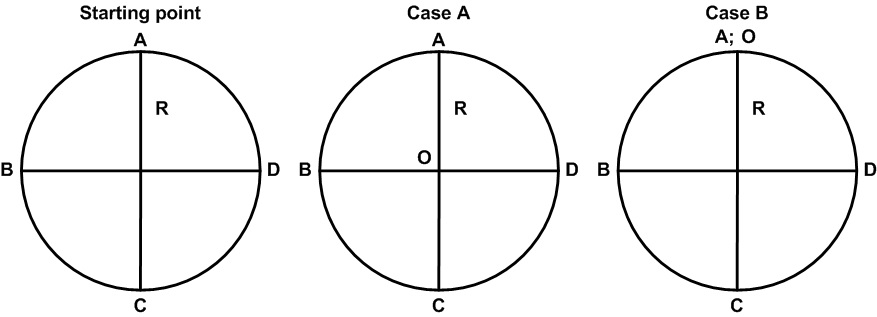 Graph 1: theoric case and its two factual solutions.
There are four different types of available vehicles to choose, and each one has different acquisitive costs and capacity according to chart 1.
 Chart 1: capacity and costs of available vehicles.
The operational conditions for this theoretical and practical case study are the following:
 Chart 2: Vehicle fleet’s operational costs.
Considering a null residual value for the vehicles, a traveling road of mixed urban and highway conditions, stopping in locations A, B, C, D won’t be considered, and vehicles are used to the 100% of their capacity.
Service level is the highest individual time (hours) from all vehicles in the fleet, from the time they leave the base “O” until they come back to it after completing the delivery and pick-up of packages in the locations A, B, C, D.
Case A
Graph 2 represents the different factual solutions to use one, two, three and four vehicles, their capacities and routes in different colors, for Case A, in which the base is at the center of the circle.
 Graph 2: relationship between routes and the number of vehicles for case A.
The attached chart 3 represents solutions for the generic case; the following chart 4 represents the results of the four possible cases using the values in charts 1 and 2.
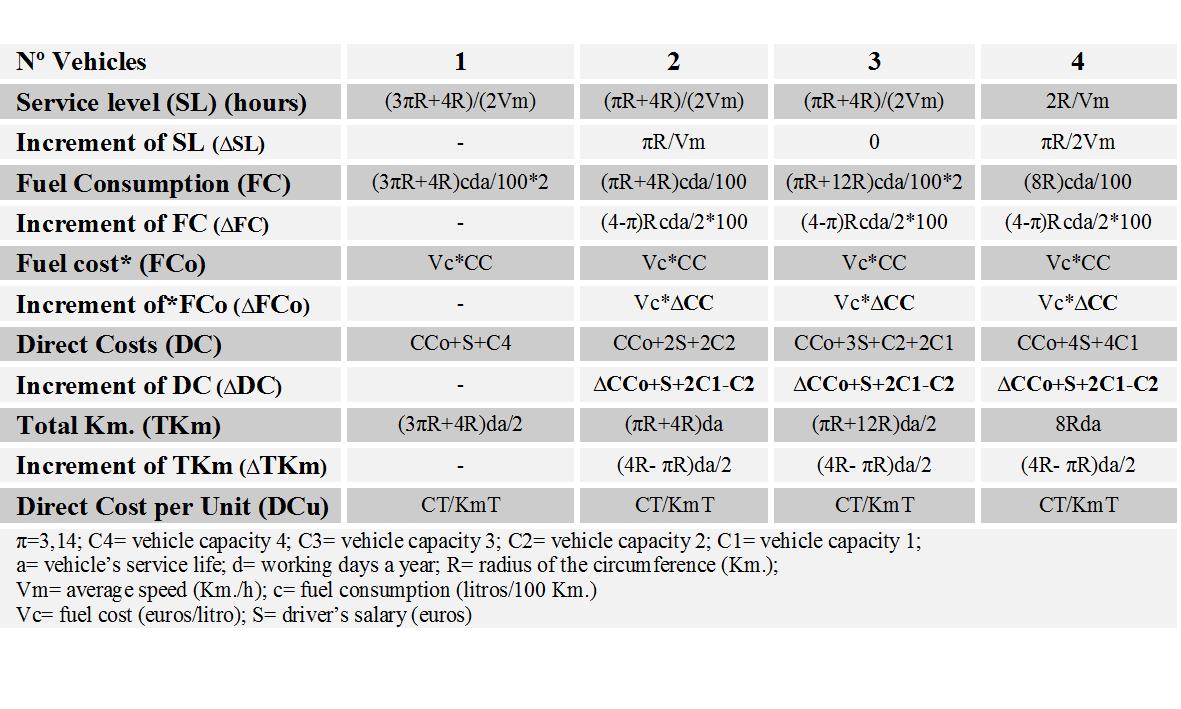 Chart 3: solutions for the generic case
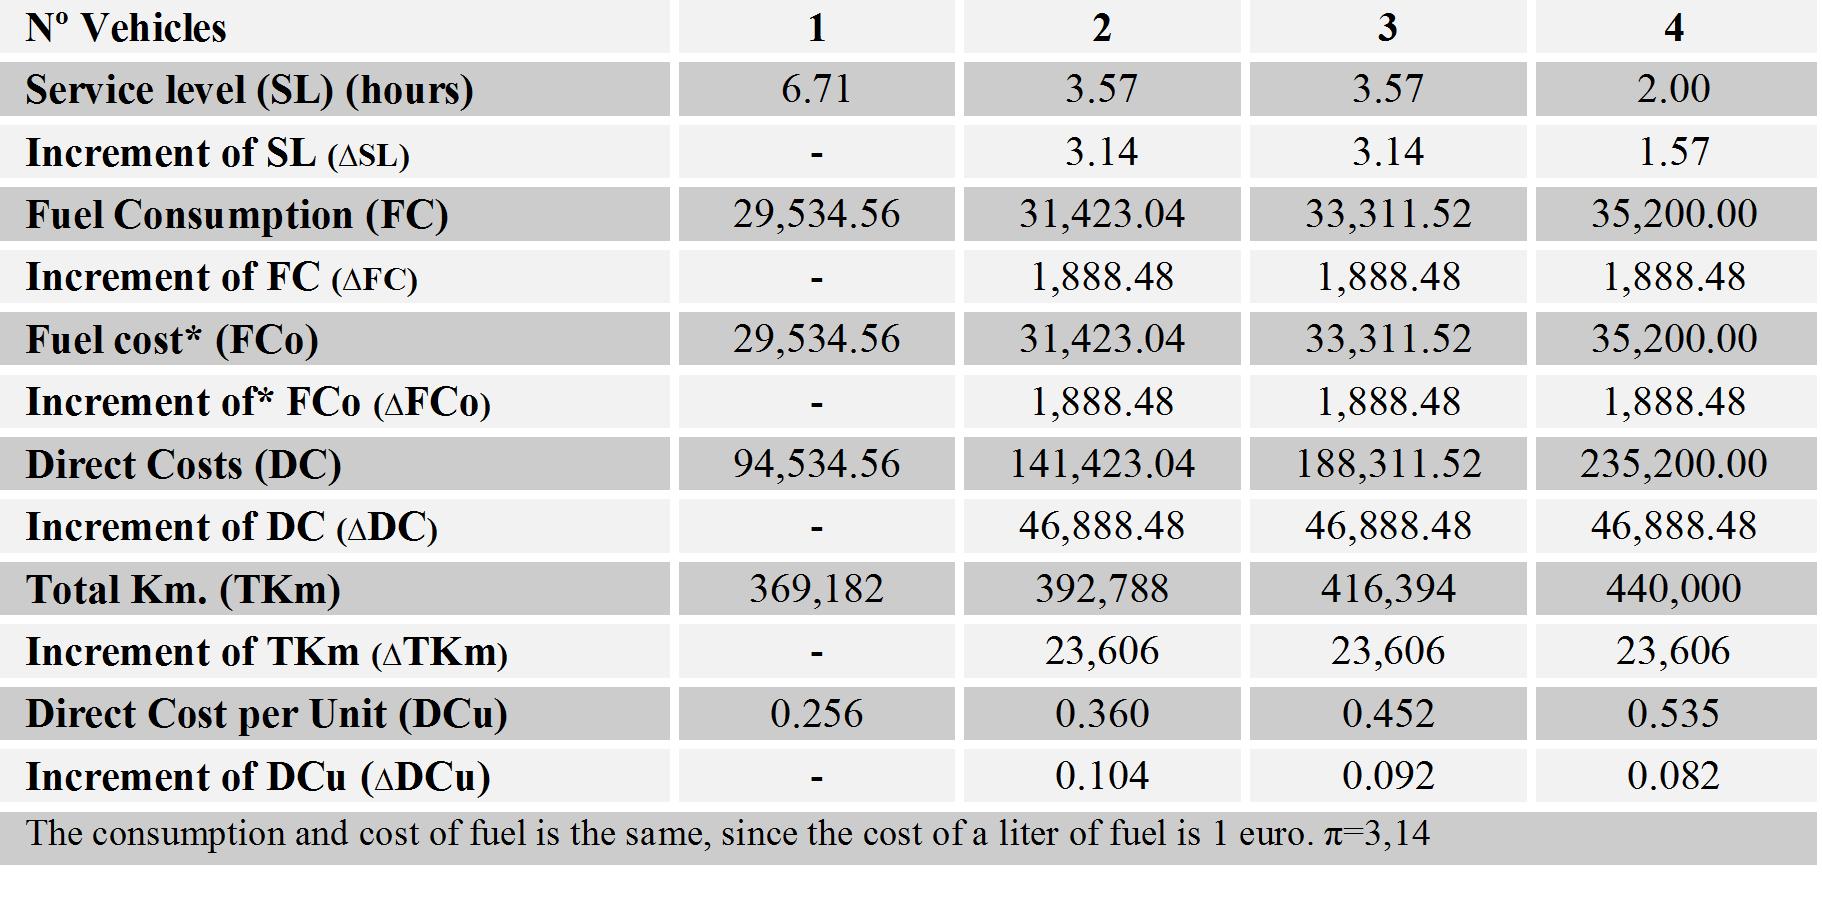 Chart 4: results obtained from the four possible cases for case A.
Service level, fuel consumption, direct costs, total kilometers traveled and direct costs per unit are increased by the number of vehicles.
The increment produced in the service level are directly proportional to Pi (π=3.14), and the increment produced by the fuel consumption, direct costs, and traveled kilometers are constant. These increments are defined by the equations shown in the attached chart 3.
In the case of three vehicles, the service level is equal to the case of two vehicles, but the fuel consumption, directs costs, total kilometers traveled, and direct costs per unit are higher, for this reason this solution is dominated by the use of two vehicles, and the solution of three vehicles should not be taken into consideration. The case of using three vehicles proves that in the fleet could be solutions dominated by better ones that must be identified and eliminated among the options.
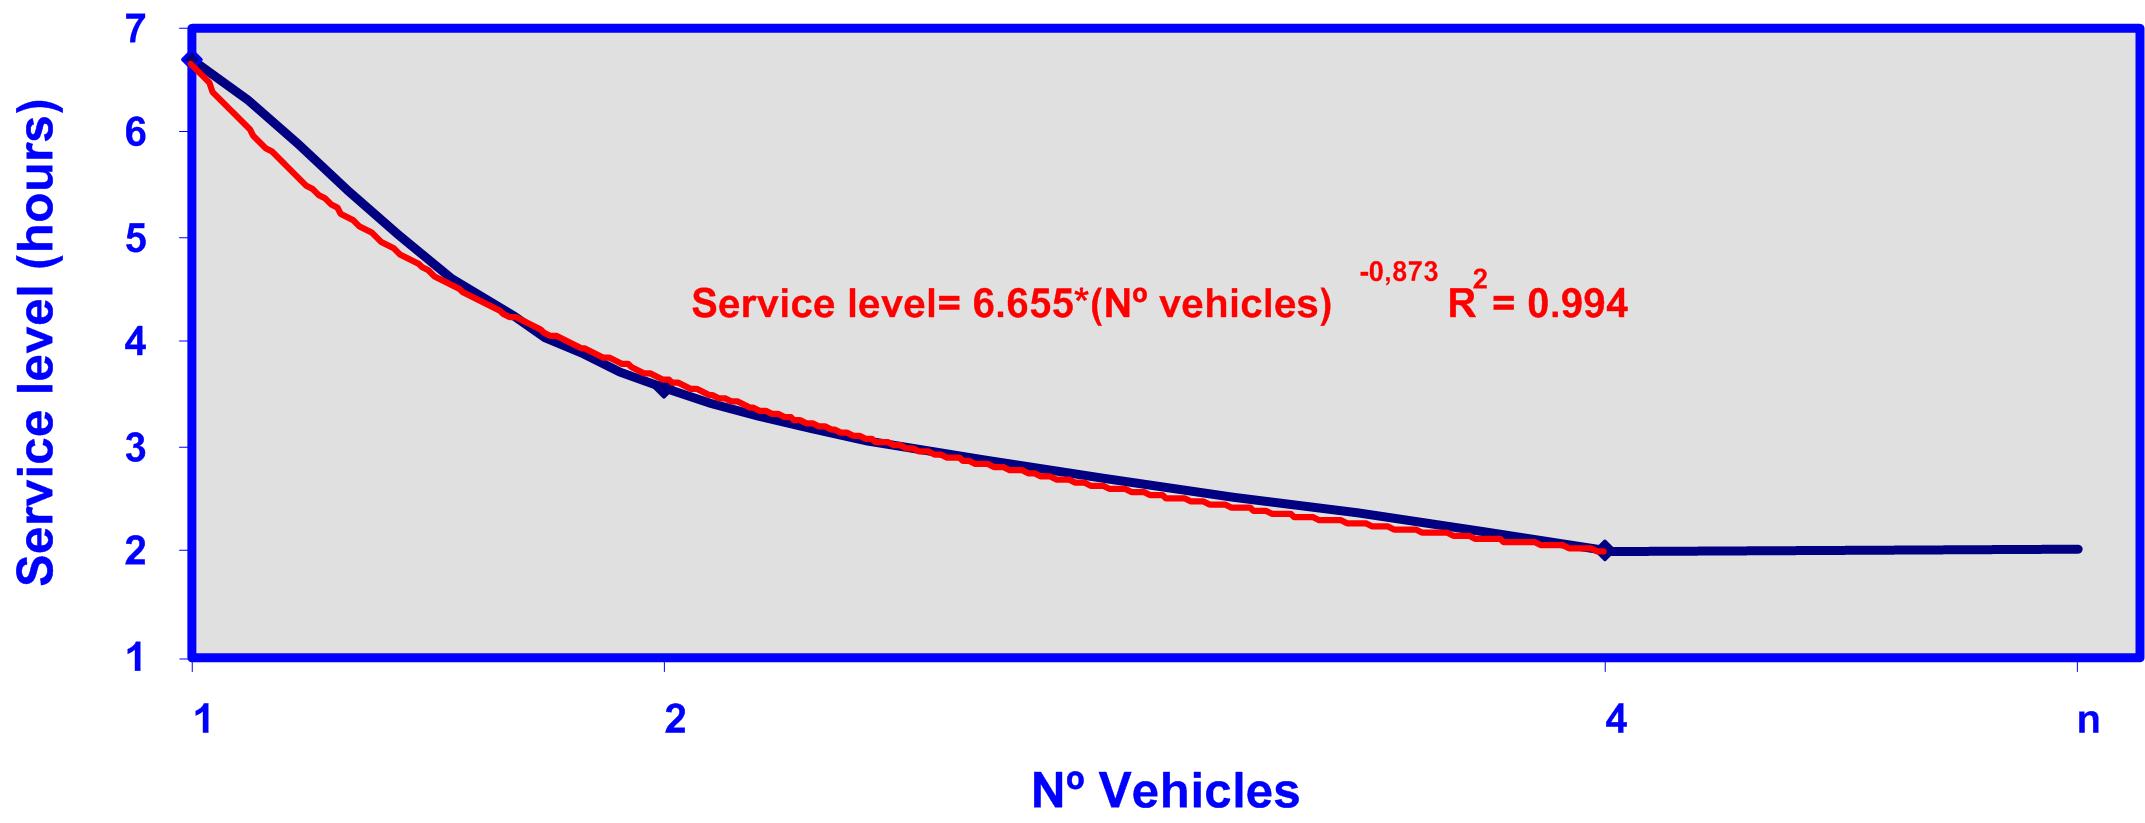 Graph 3: relationship between the number of vehicles and the service level for case
Graph 3 shows that as the number of vehicles increases, the increment in the service level decreases (blue line). The maximum service level corresponds to using four vehicles, and after using more than four vehicles the service level stays constant.
The correlation between the service level and the number of vehicles is significantly high (R2) and corresponds to the potential equation shown in graph 3 (red line).
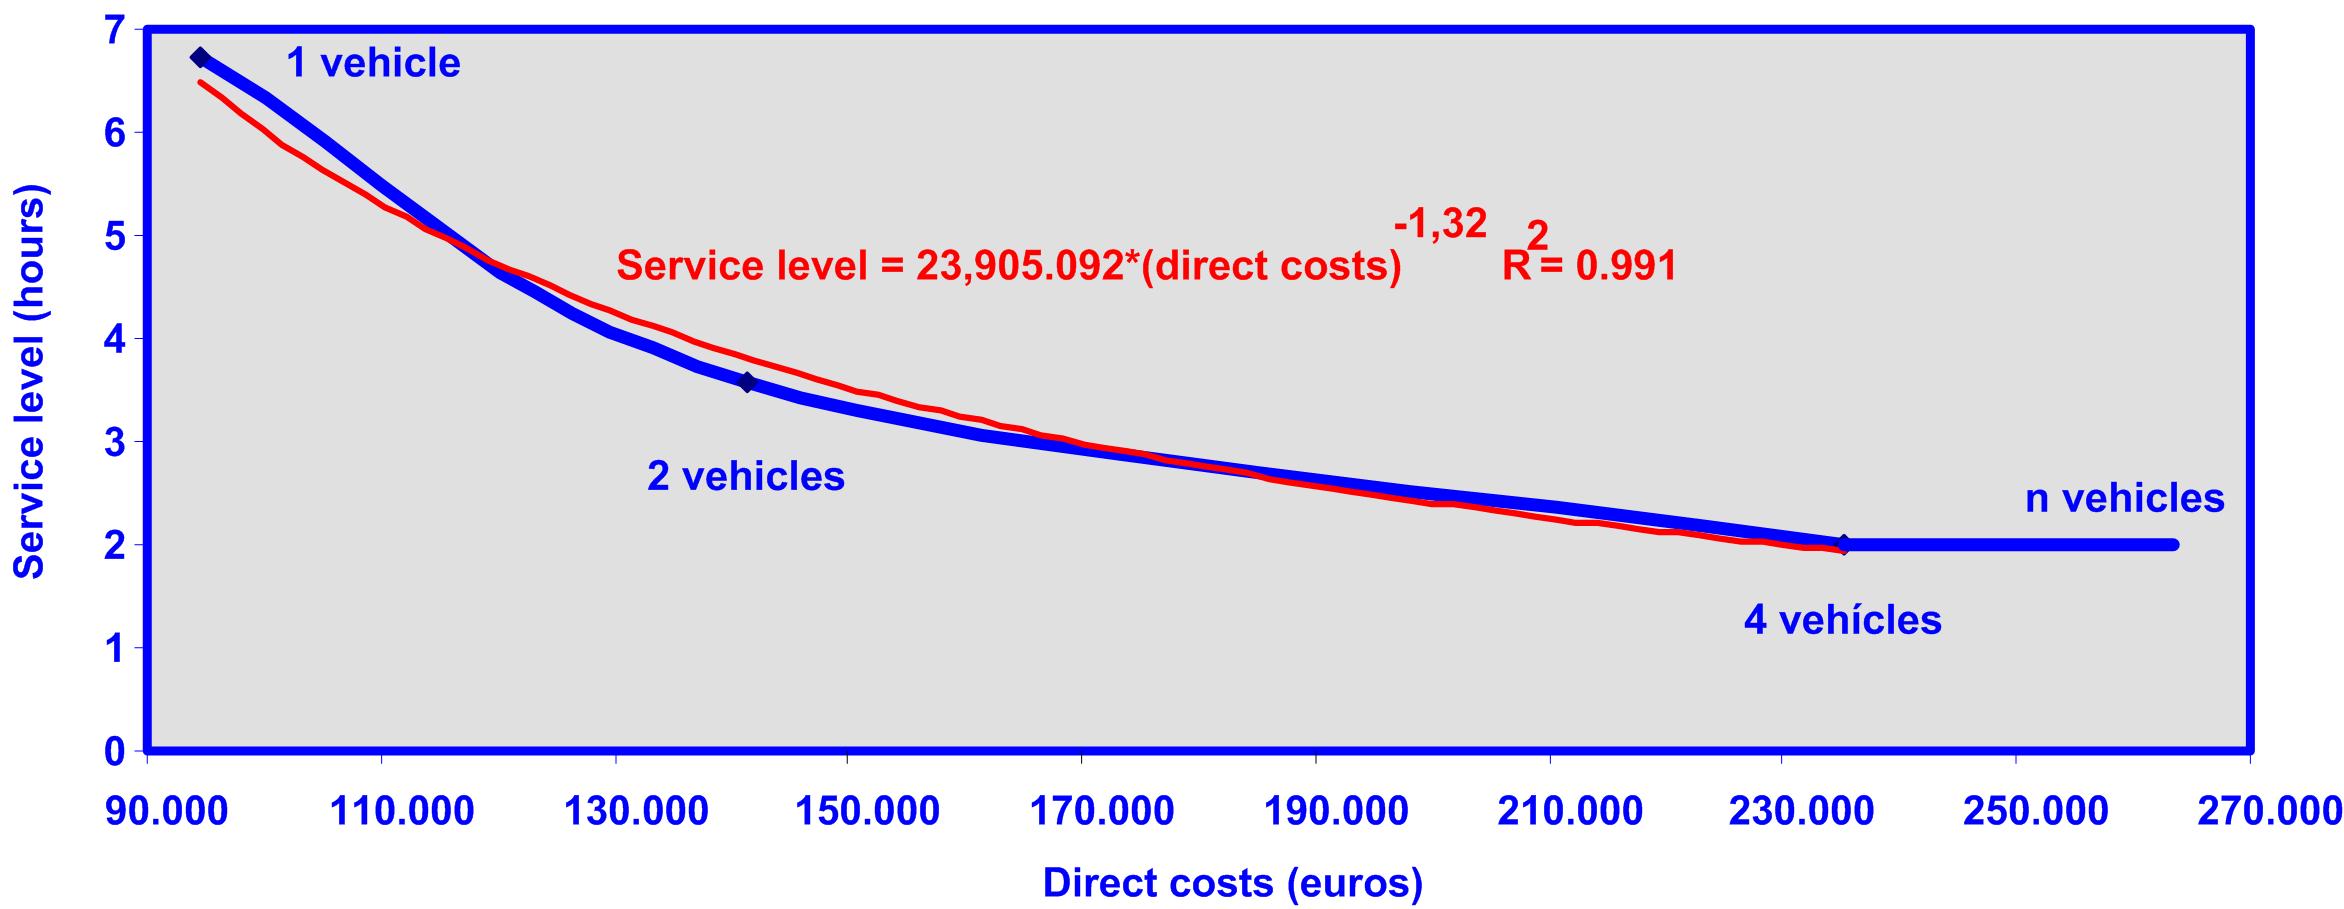 Graph 4: relationship between service level and direct costs for case A.
Graph 4 shows that as the direct costs increase, the increment of the service level decreases. The maximum service level corresponds to using four vehicles, which is associated with certain directs costs, and after using more than four vehicles, the service level seems constant but the direct costs increase.
The correlation between the service level and direct costs is significantly high (R2) and corresponds to the potential equation shown in graph 4 (red line).
In this theoretical model, if these initial conditions are modified such as if the acquisition costs were higher, the fuel consumption would increase, just like the driver’s salaries, curve A would move further into the right like shown on graph 5 in curve B, and for the same service level the direct costs would be higher.
On the contrary, if the acquisition costs were lower, the fuel consumption and driver’s salaries would decrease, curve A would move further into the left like shown in graph 5, transforming into curve C, and for the same service level the direct costs would be lower.
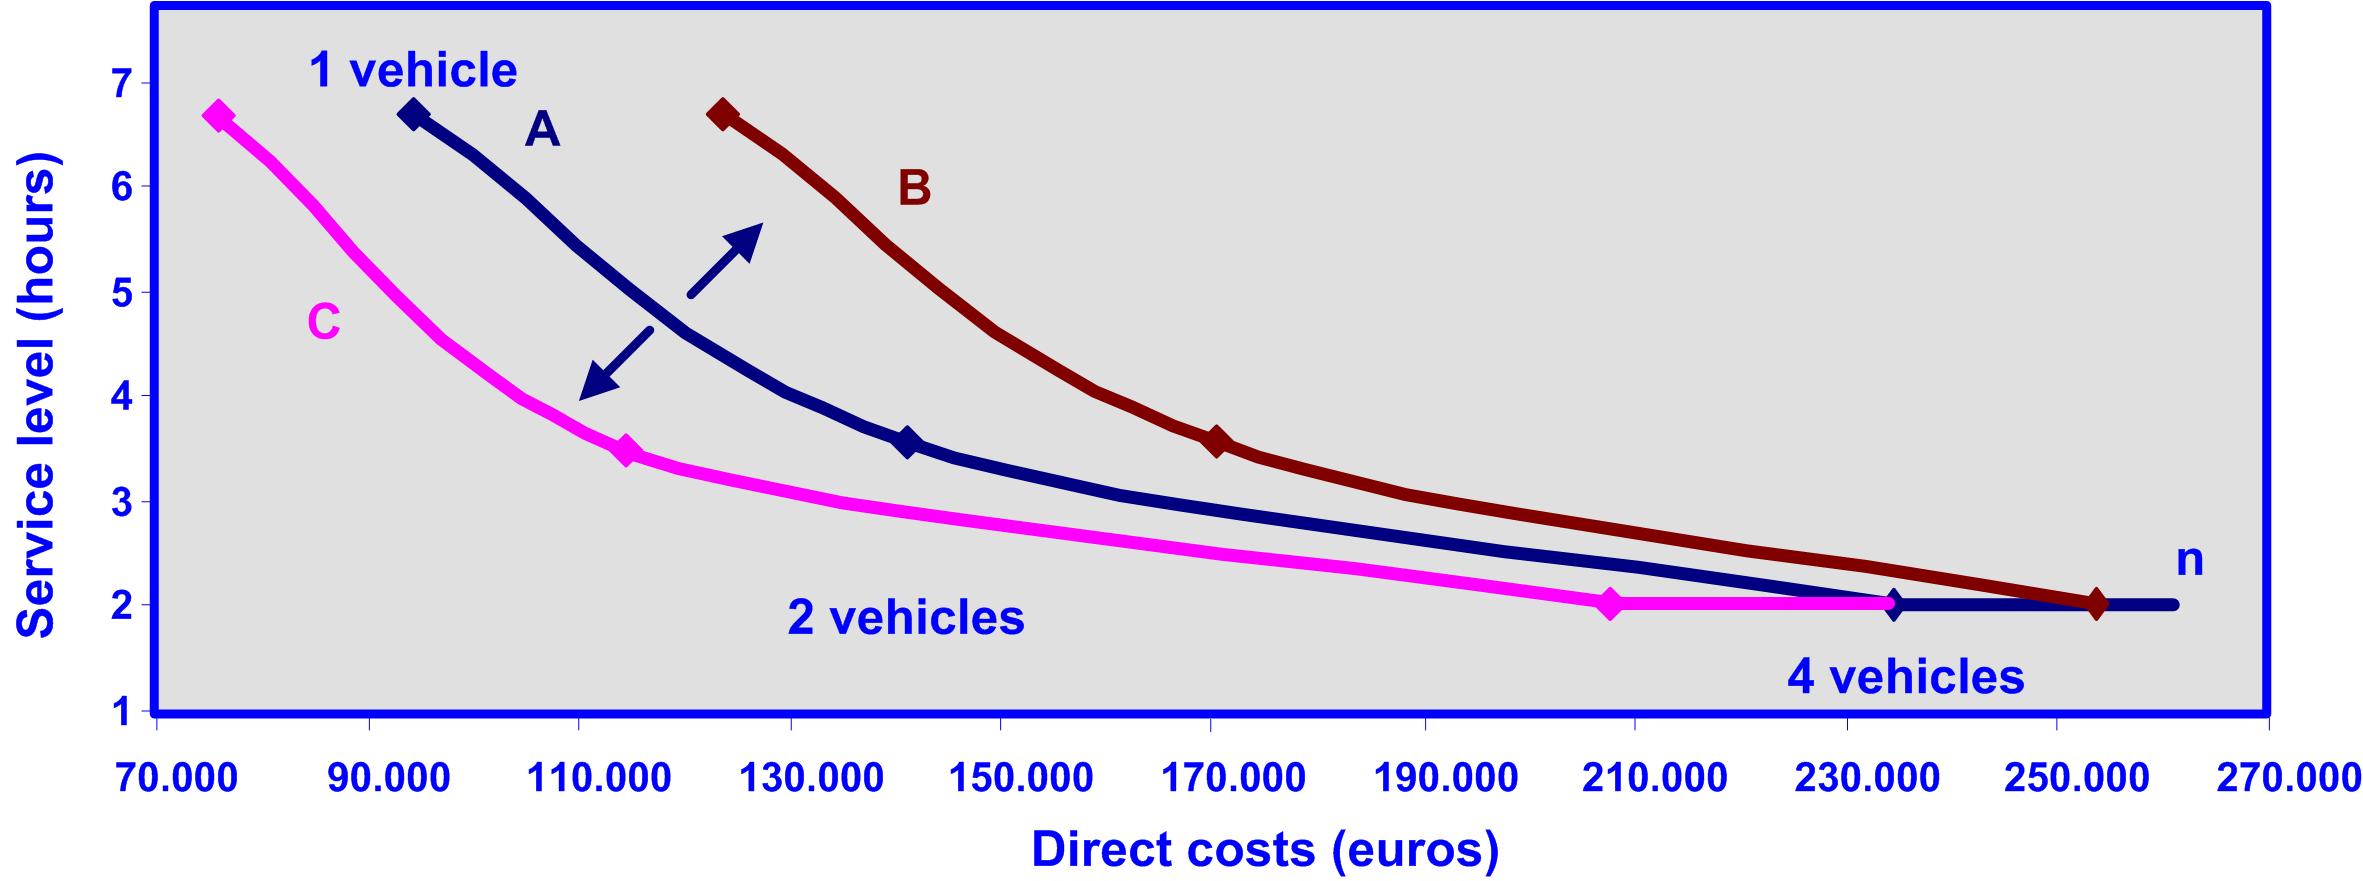 Graph 5: relationship between the service level and the increment or decrement of direct costs for case A.
The service level can increase or decrease, if the average speed increases or decreasing according to with the corresponding increment or decrement of fuel and its associated cost.
Case B
Graph 6 shows the different cases of using one, two, or three vehicles, their capacities and its routes in different colors, for case B the base is in the delivery and pick-up location A.
Graph 6: relationship between the routes and the number of vehicles for case B.
The attached chart 5 represents solutions for the generic case; the following chart 6 represents the results of the four possible cases using the values in charts 1 and 2.
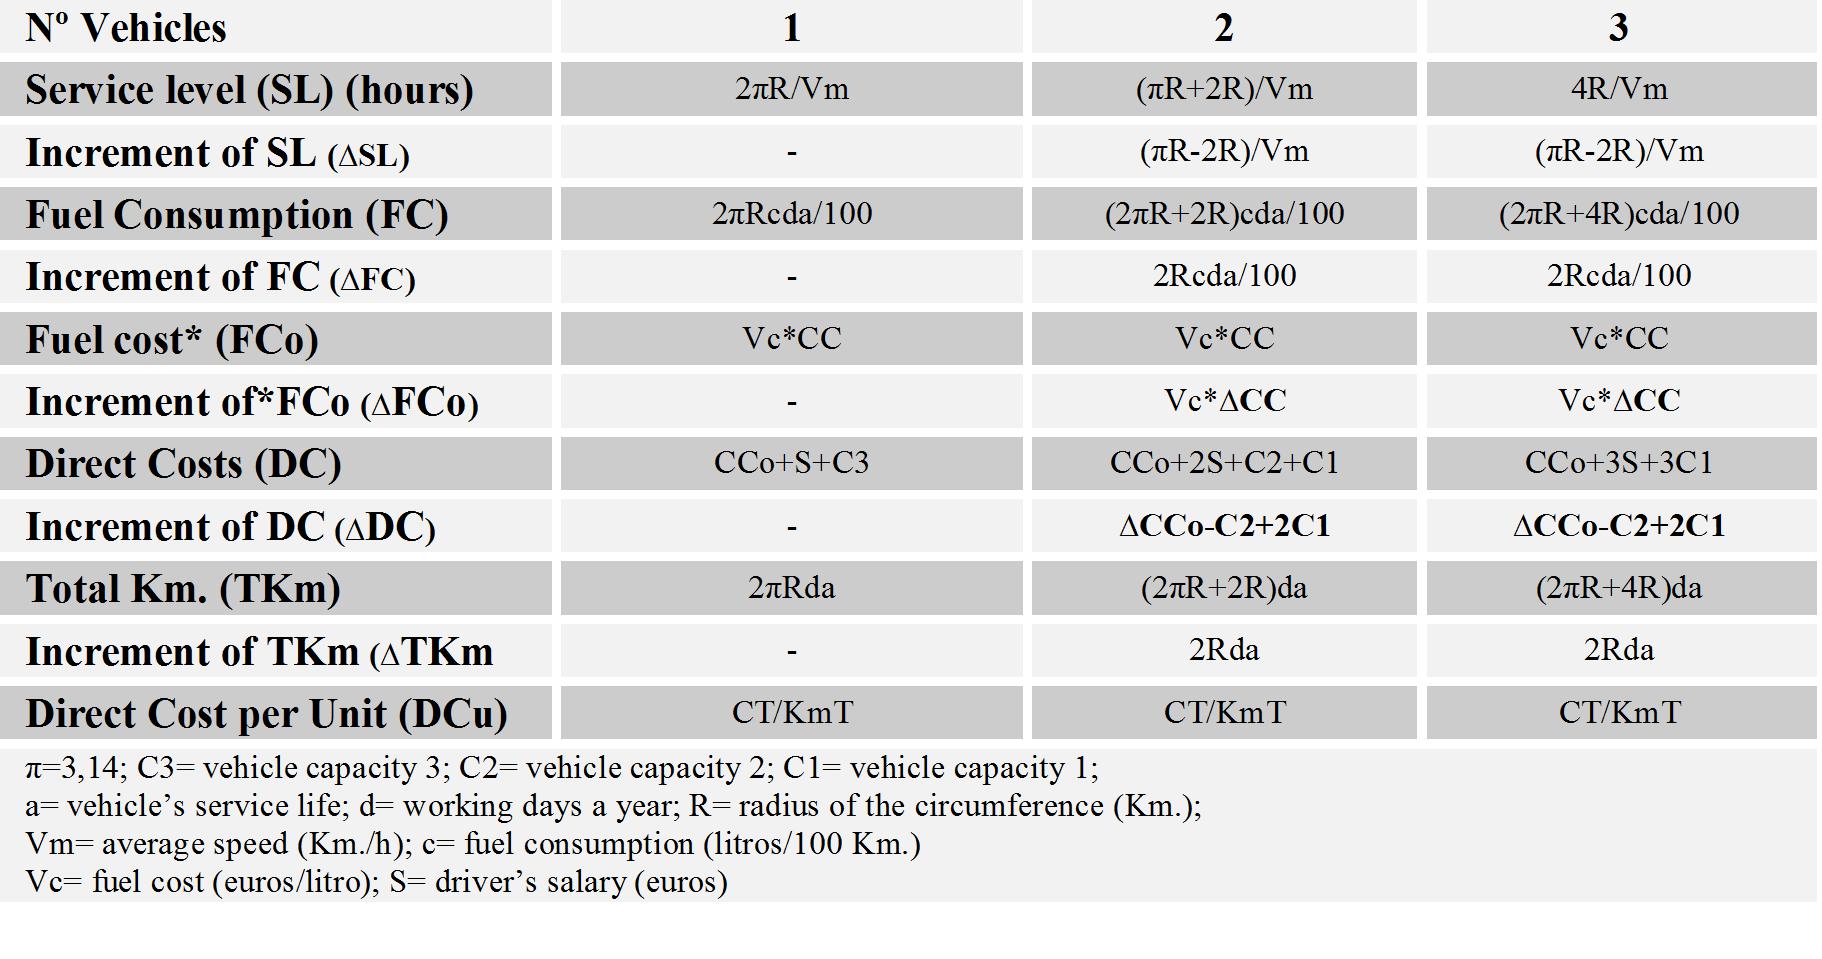 Chart 5: solutions for the generic case
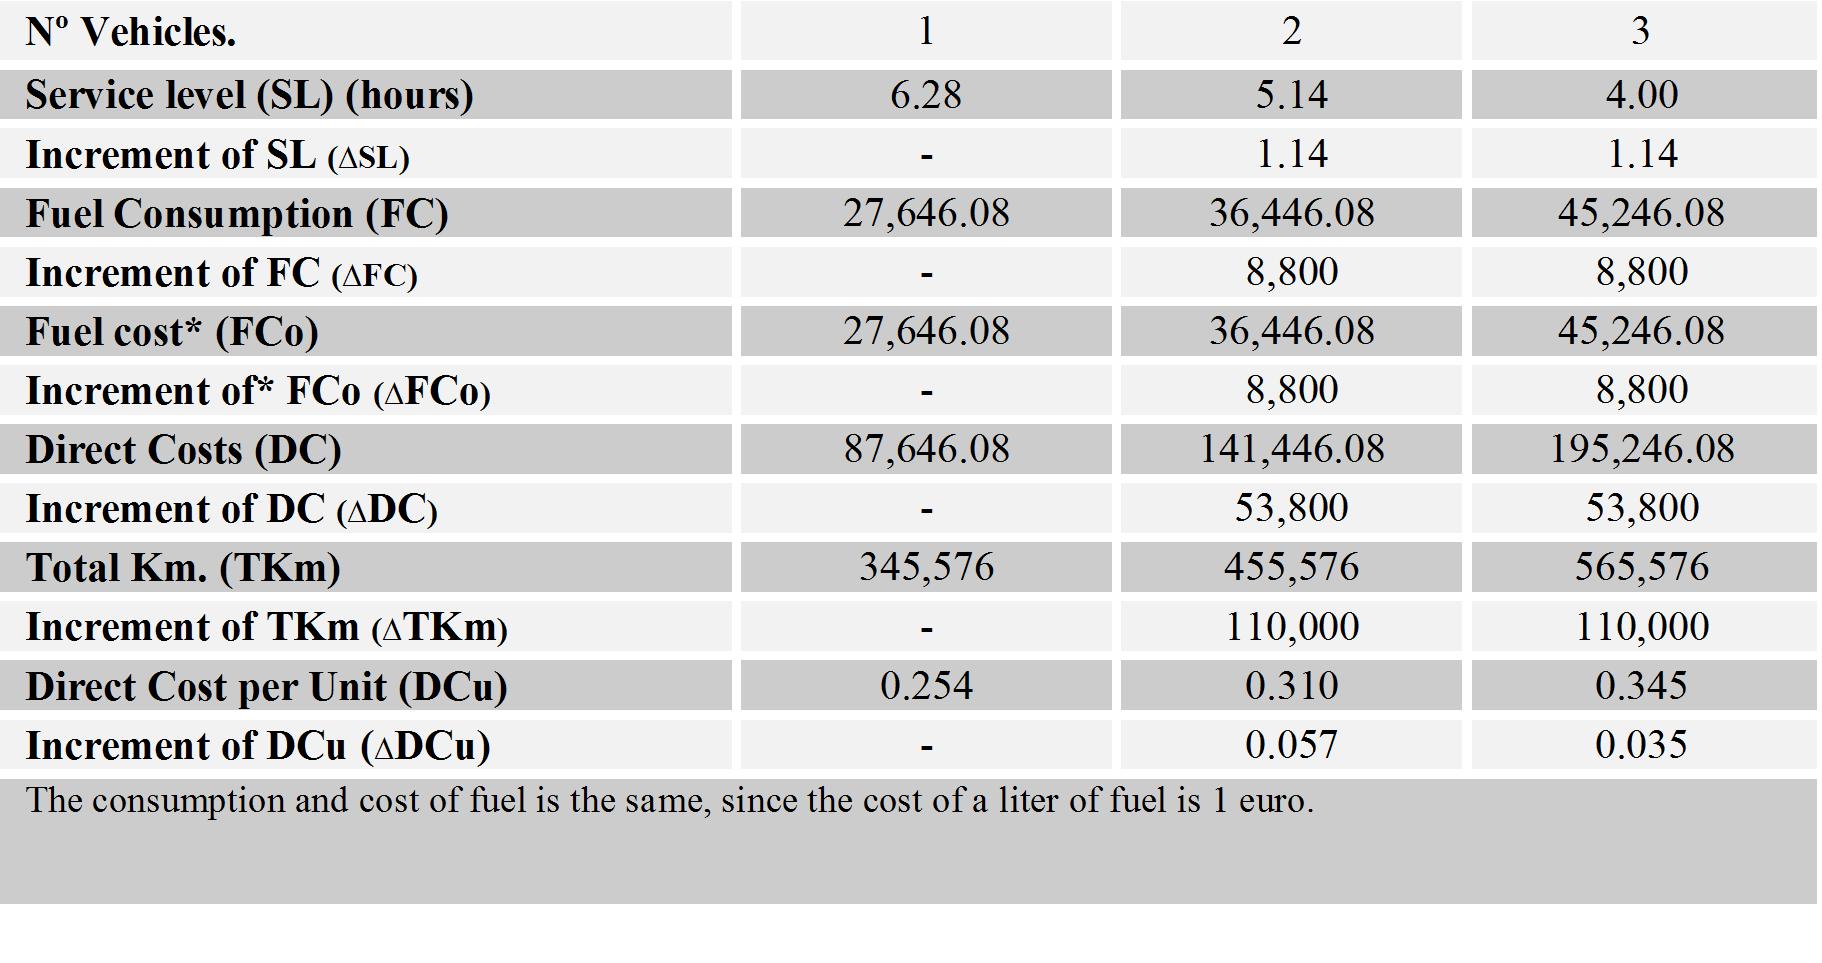 Chart 6: results of the three possible cases for case B.
Service level, fuel consumption, total traveled kilometers, and the direct costs per unit increase with the number of vehicles.
The increments on service level, fuel consumption, total costs and traveled kilometers are constant. These increments are defined by the equations shown in the chart 5.
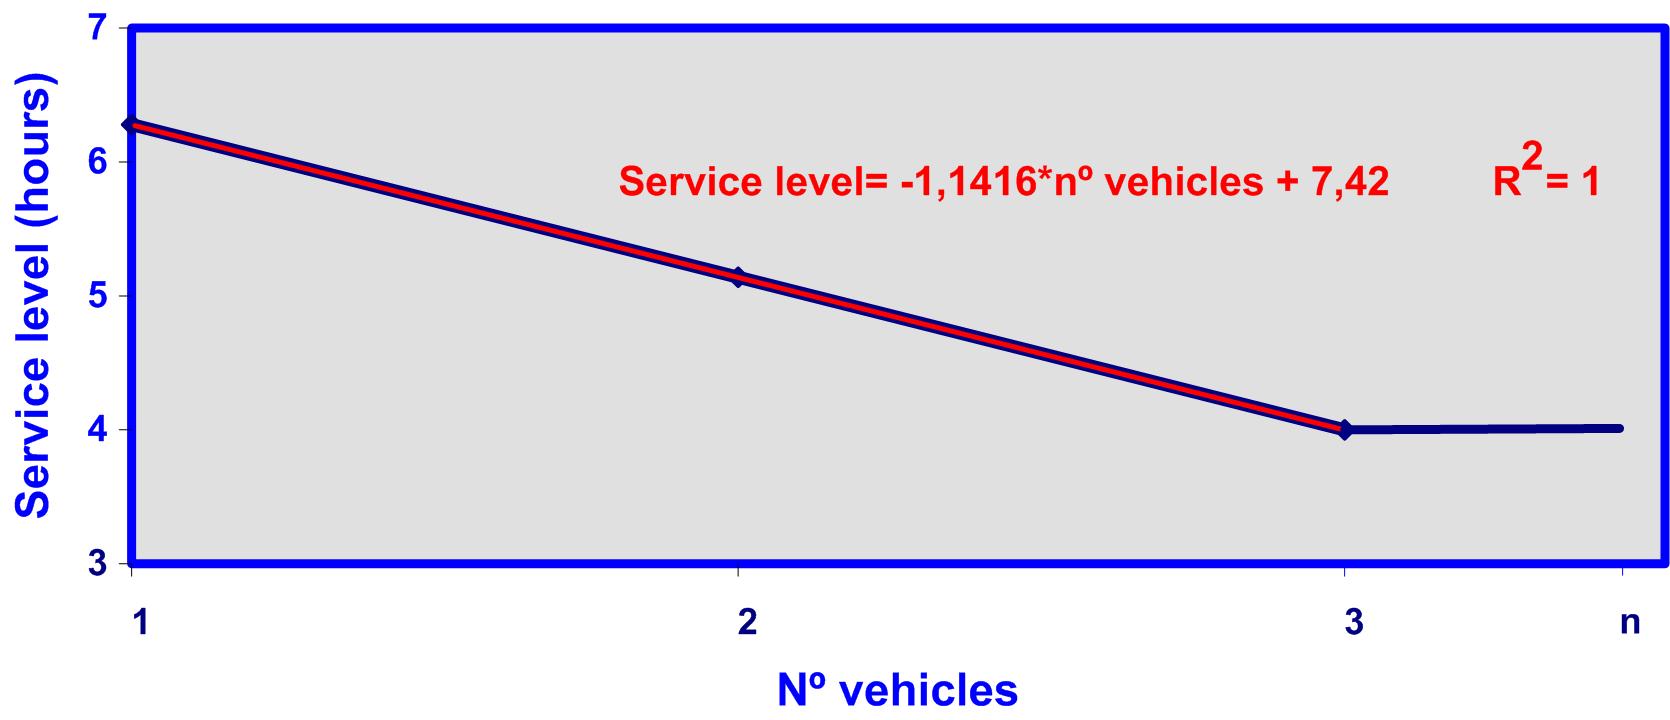
Graph 7: relationship between the number of vehicles and the service level for case B.
Graph 7 shows that as the number of vehicles increases, the service level’s increment is constant. The maximum service level corresponds to using 3 vehicles, and after using more than 3 vehicles the service level stays constant.
The correlation between service level is significantly high (R2) and the number of vehicles corresponds to the lineal equation show on graph 7 (red line).
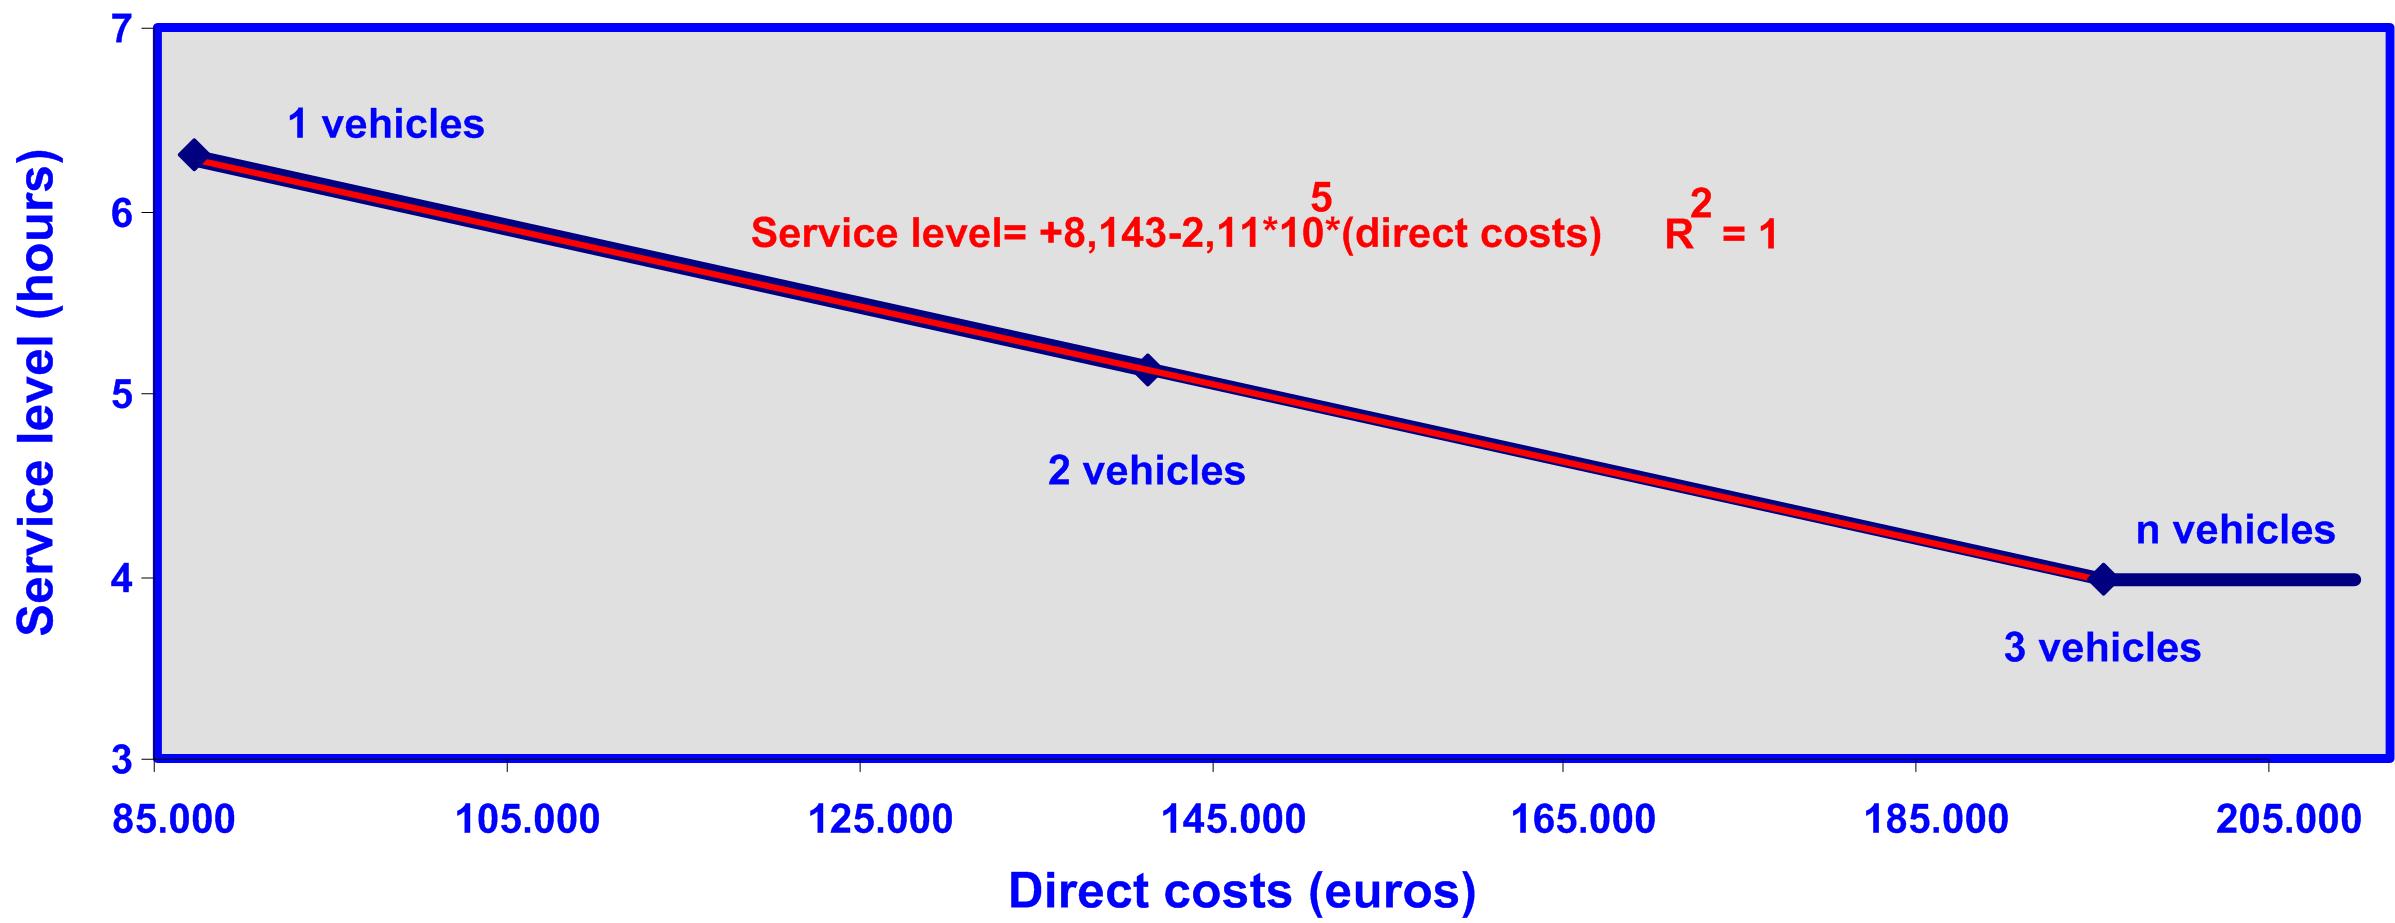 Graph 8: relationship between total costs and service level for case B.
Graphic 8 shows that as direct costs increase, the service level’s increment is constant. The maximum service level corresponds to using 3 vehicles which is associated with direct costs, and after using 3 vehicles the service level stays constant but the direct costs increase.
The relationship between service level and direct costs is significantly high (R2) and corresponds to the lineal equation shown in graph 8 (red line).
COMPARISON OF CASES A AND B
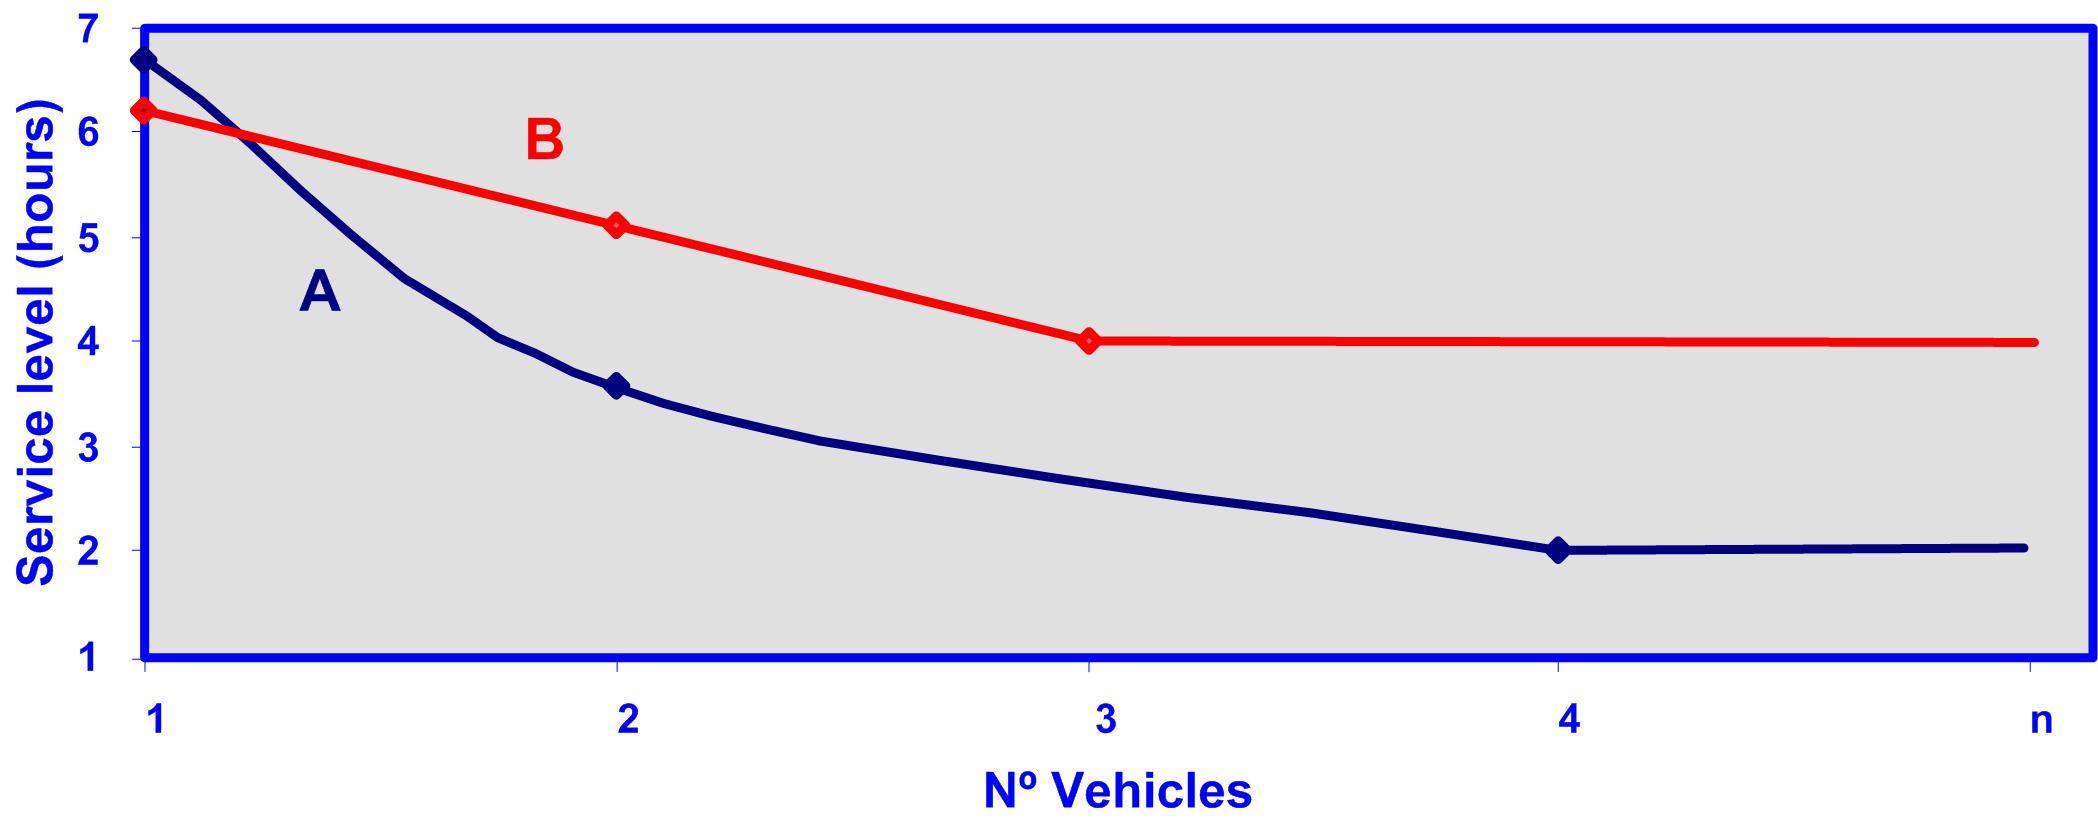
Graph 9: comparison between number of vehicles and service level for cases A and B.
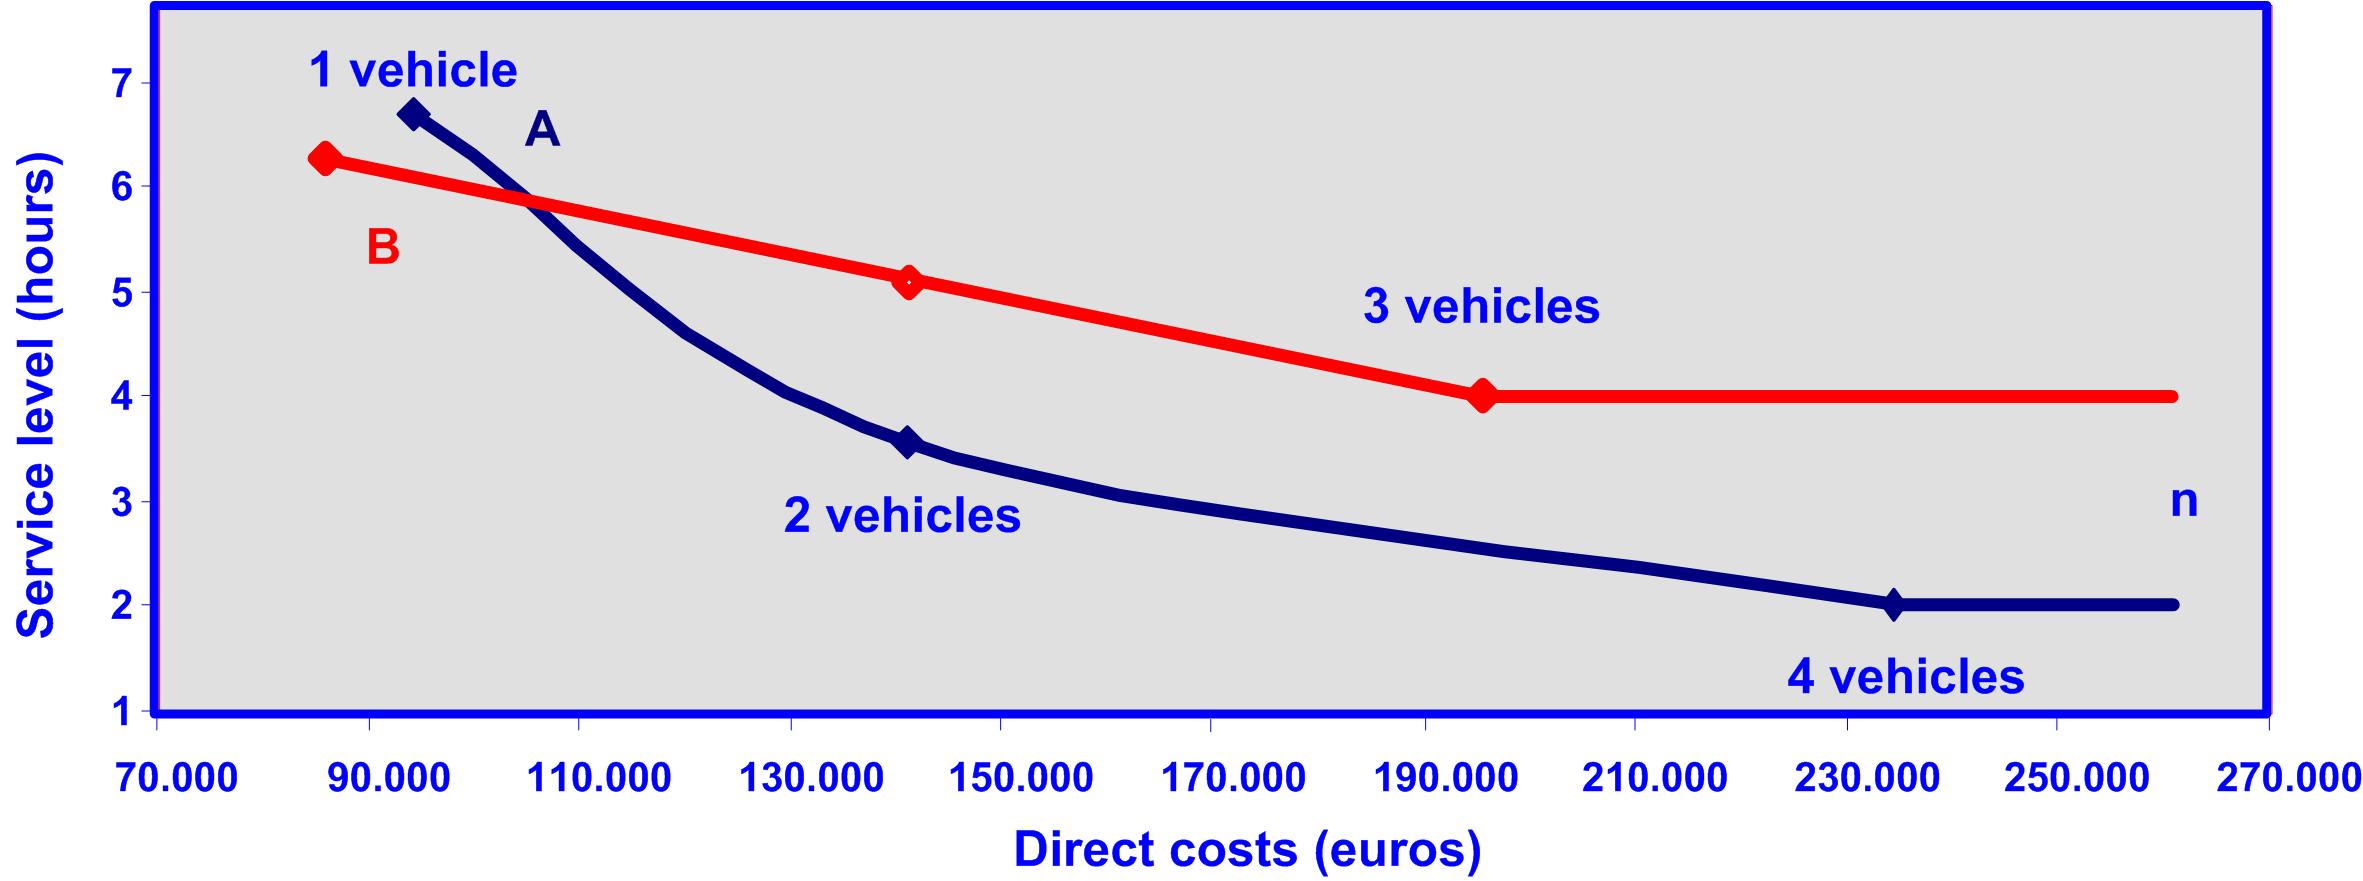 Graph 10: comparison between the total costs and the service level for cases A and B.
Graphs 9 and 10, and the charts 4 and 6 shows that if only one vehicles is used, case B provides a better service level and lower total cost, with a slight difference in case A. If two vehicles are used, case A presents a better solution than case B for 2 and 3 vehicles, since it has a better service level and lower total costs.
The solution for using only one vehicle in case B is only factual if in the future there won’t be any improvements in service level increasing the number of vehicles, by the contrary if the company operates in a very competitive market, there would be a need to increase the number of vehicles in the future, and because of this case A is better.
Conclusions for the theoretical and practical case study
The principal conclusions for the theoretical and practical case study that could be extended to any kind of fleet would be the following:
- Every service level has an associated number of vehicles and direct costs.
- There is a maximum service level for a determined number of vehicles and direct costs, from which if any other vehicles added, the service level stays constant but the direct costs increase.
- There can be solutions that are dominated by better ones, for which these should be identified and eliminated from between the options.
- A vehicle fleet can be characterized or defined by its behavioral pattern according to charts 3 and 5, and graphics 3, 4, 7 and 8 in this case study, and they’re of great help to implement, plan and make forecasts.
- Depending on the characteristics of the fleet, which in this case study would be the localization of the base (O) and the delivery and pick-up locations, there would be different characterization or behavioral patterns like shown in cases A and B.
- The more vehicles, the higher are the increment in the variable operational costs, mostly because they’d travel a higher number of kilometers.
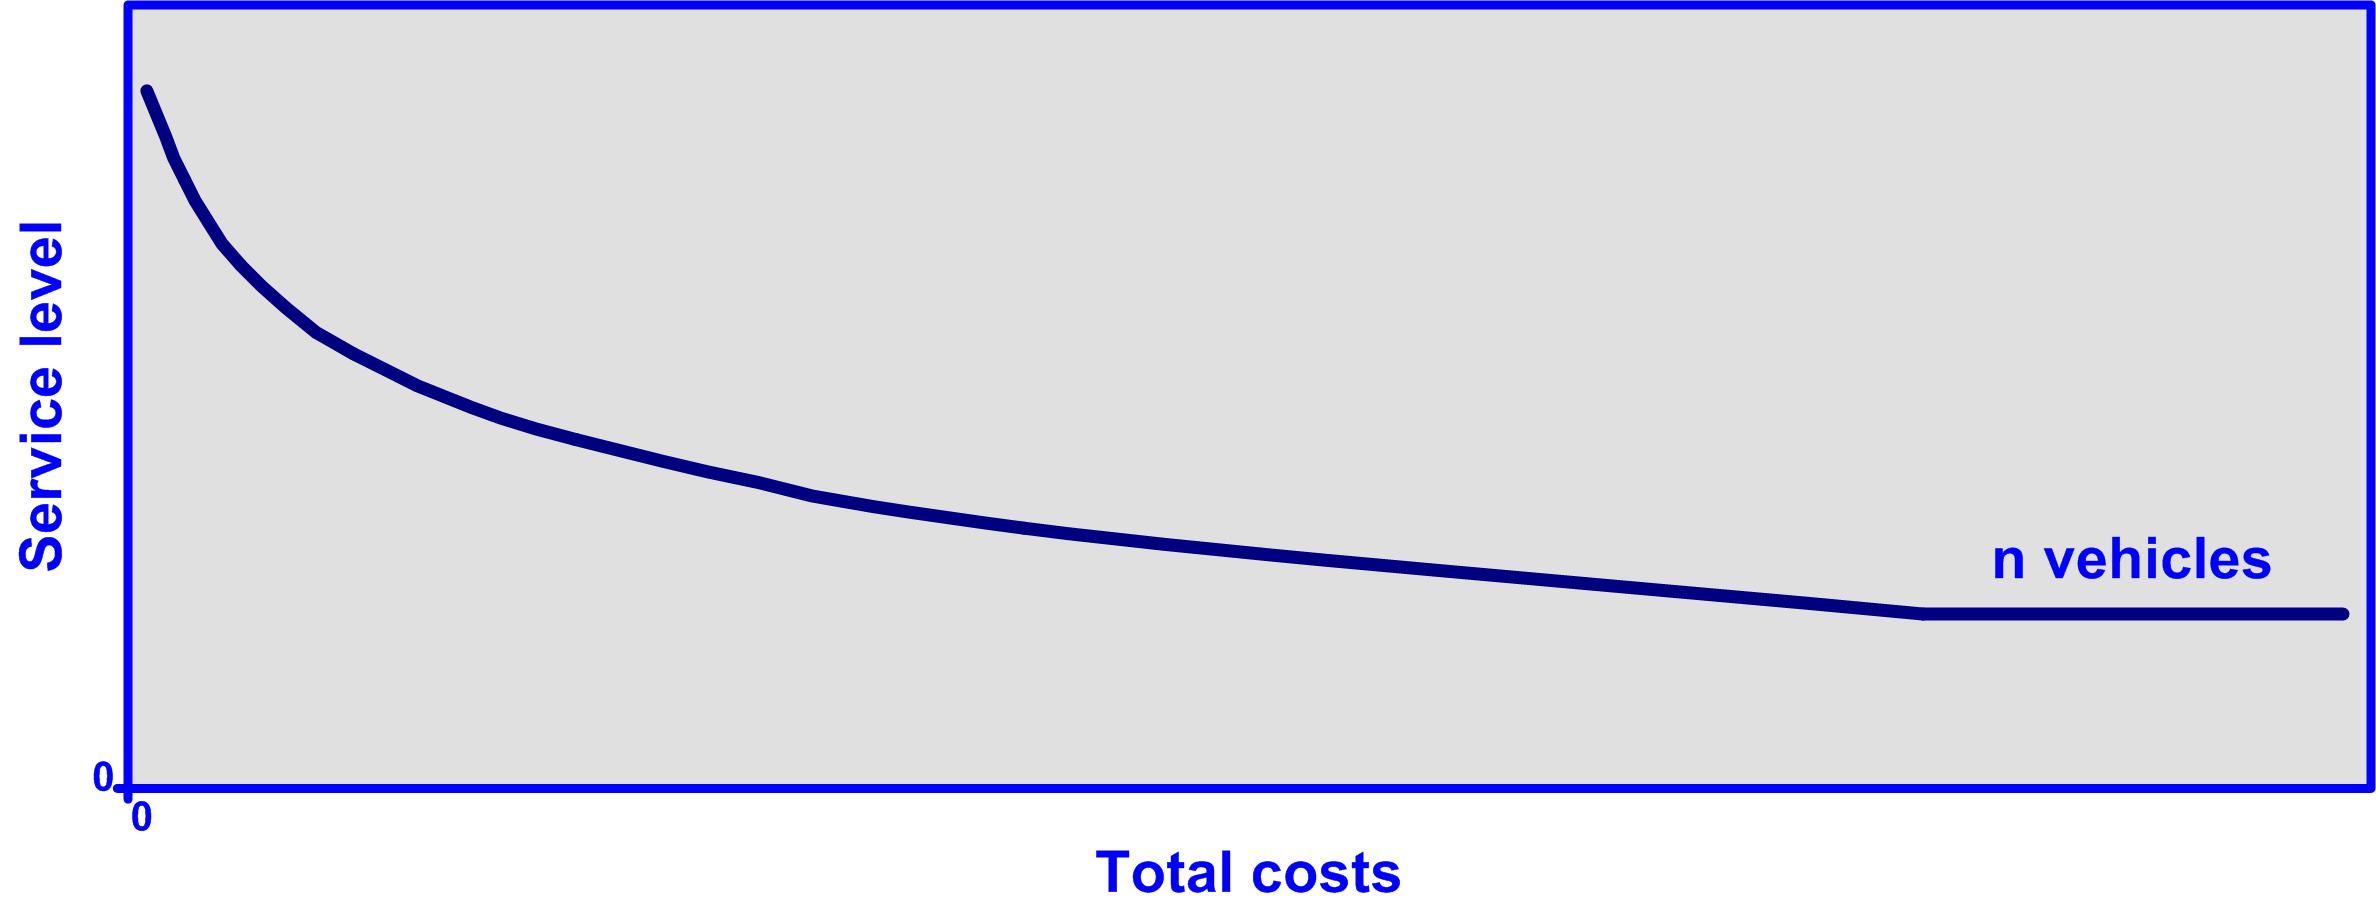
- The more vehicles, a bigger facility to stock them would be needed, as well as more personnel for the fleet, drivers, processes, controls, etc. and for this reason the increment in the total costs (direct and indirect) increases. Most vehicle fleets that have planed routes follow a characterization of behavioral patterns like the ones shown in graphic 11, where the maximum service level is obtained with n vehicles that correspond to the number of delivery and pick-up locations.
Graph 11: Relationship between the service level and the total cost for a vehicle fleet with planned routes.
The following factors are some examples that have a great impact in the fleet’s effectiveness and productiveness, which would lead to lower total costs and a better service level; like the existence of vehicle fleet management policies, the use of the vehicle’s full capacity, planning routes, establishing vehicles acquisition and selling central, establishing the adequate processes, having a fleet management software, an appropriate command chart, analyze data, choose the right selling channel, outsource certain activities or the control and follow-up of vehicles to third-parties. In the following posts these and other factors will be developed.
Tell me your opinión:
info@advancedfleetmanagementconsulting.com
 I´m a Fleet Management expert, and the manager of Advanced Fleet Management Consulting, that provides Fleet Management Consultancy Services.
